Kubernetes probes are a mechanism for determining the health of a container running within a pod. Kubernetes supports three types of probes:
- Liveness,
- Readiness,
- Startup.
Each of these probes serves a different purpose and helps Kubernetes manage the container lifecycle.
In the following diagram, I have tried to represent the type of checks and probes available in Kubernetes and how each probe can use all the checks
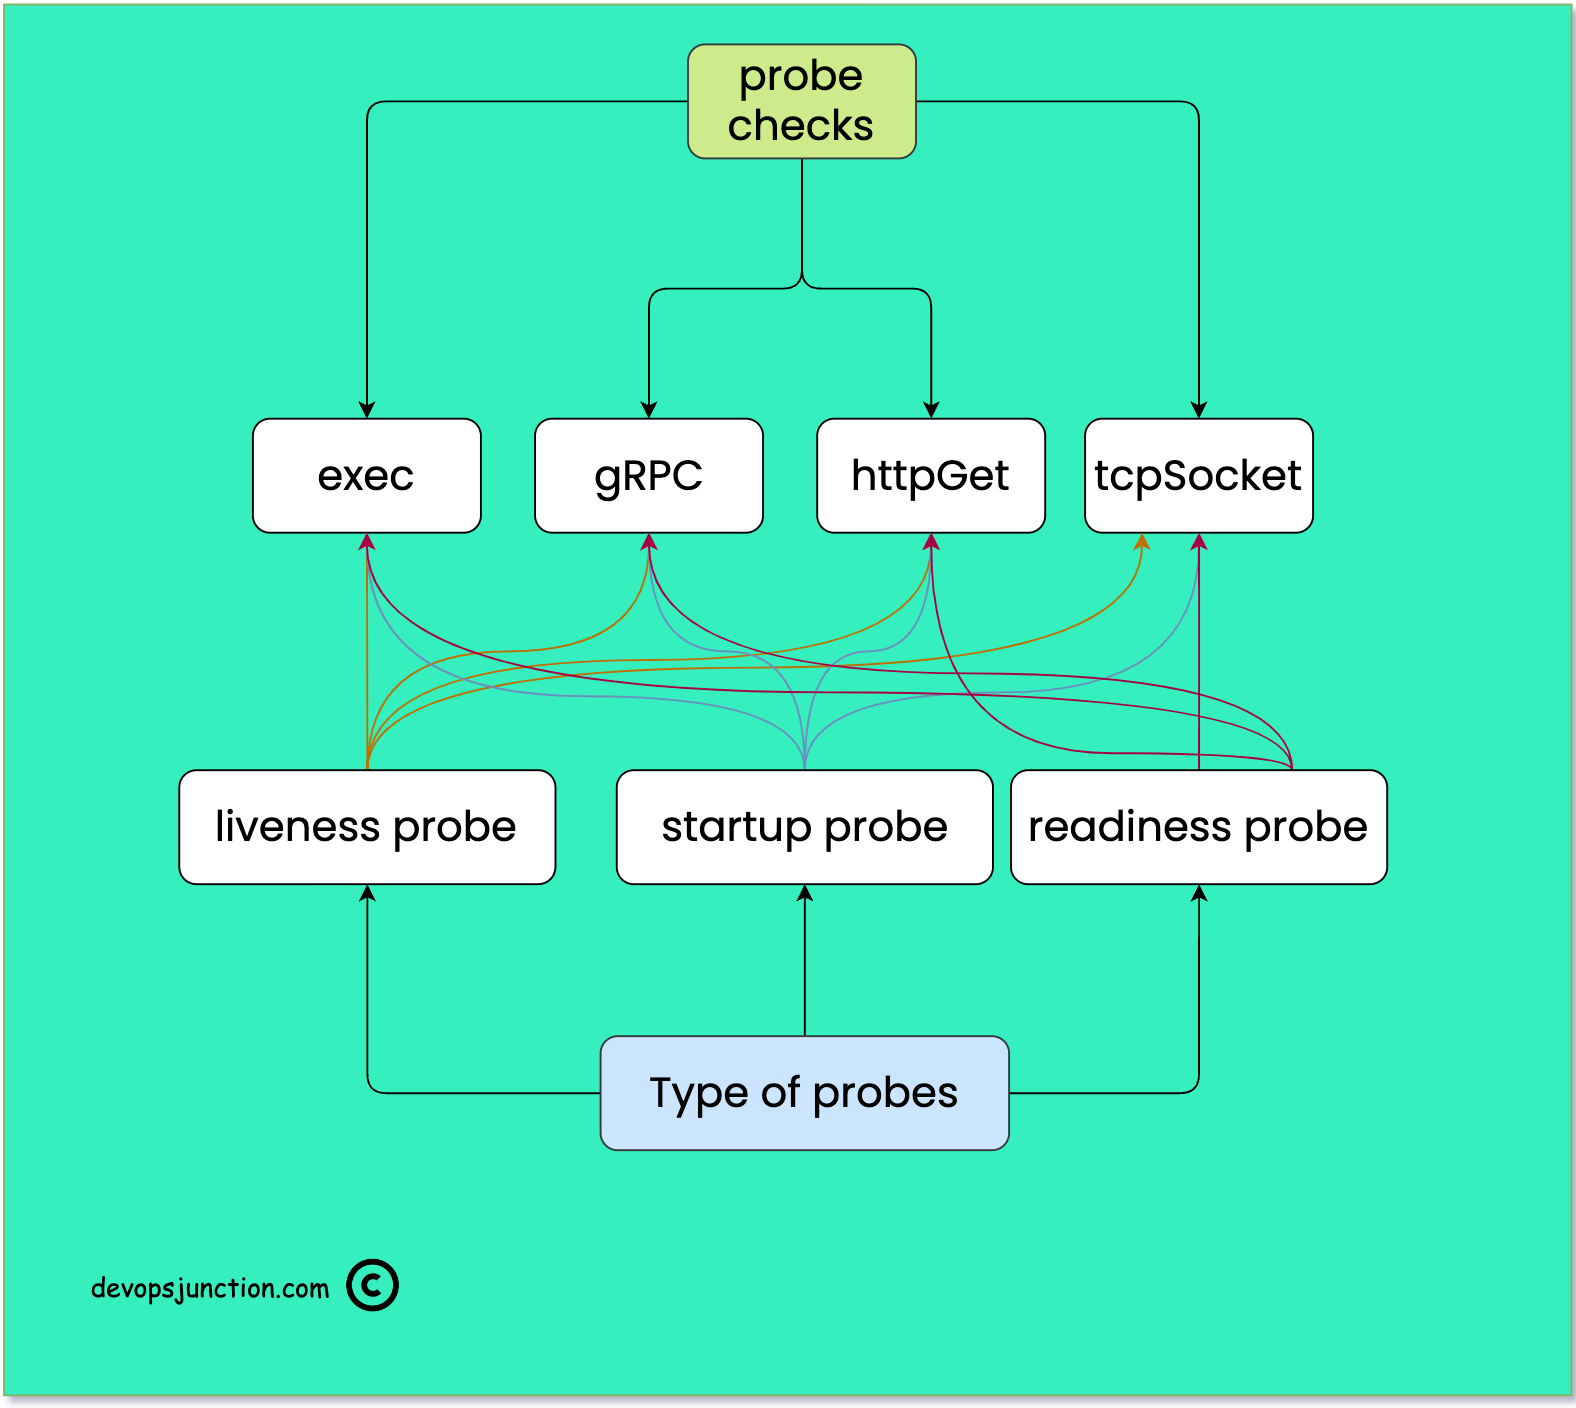
Types of Kubernetes Probes
Liveness probes are used to determine if a container is alive or dead. If a container fails a liveness probe, Kubernetes will kill the container and restart it as per the container's restart policy. Liveness probes are useful for detecting when an application has stopped responding and needs to be restarted.
Based on the configuration we define liveness probes and constantly check the application state and this is a key element to ensure the reliability of our application. If the Liveness probe is not configured right we might end up having application failures during the transit.
Readiness probes are used to determine if a container is ready to accept traffic. If a container fails a readiness probe, Kubernetes will remove the container from the service endpoints, meaning that no traffic will be routed to that container until it passes the readiness probe. Readiness probes are useful for ensuring that a container is fully initialized before it begins accepting traffic.
Readiness probes run on the container during its whole lifecycle.
Liveness probes do not wait for readiness probes to succeed. If you want to wait before executing a liveness probe you should use initialDelaySeconds or a startupProbe.
Startup probes are used to determine if a container has started up successfully. Startup probes are similar to readiness probes, but they are used specifically during the startup phase of a container. If a container fails a startup probe, Kubernetes will kill the container and restart it. Startup probes are useful for detecting when an application needs more time to start up than expected.
Startup probes take precedence and all other probes are disabled if a startup probe is provided until it succeeds.
Types of Kubernetes Checks
All of these probes can use any of the following checks to determine the health of the pod
- exec
- gRPC
- httpGet
- tcpSocket
exec: Run a command inside a container, Considered Successful if the return status code is 0 otherwise failed
gRPC: If the Container support gRPC transmission and has gRPC-based health checks, you can use this check mechanism to validate the health. gRPC probes are an alpha feature and are only available if you enable the GRPCContainerProbefeature gate.
httpGet: Perform a Simple HTTP get request on the specified port and path and on the default POD IP. it's like checking http://localhost:5000/healthz if the HTTP response code is between 200 to 400 and considered successful otherwise failure.
tcpSocket: Performs a TCP check against the Pod's IP address on a specified port. The diagnostic is considered successful if the port is open. If the remote system (the container) closes the connection immediately after it opens, this counts as healthy.
Probe Configurations
Besides the Kubernetes Probes and the types of checks available. there are supporting configuration elements which can help us drive the probes to customize and meet our exact requirement
For example, we have so far seen the type of Probes and checks.
But what if you want to add some delay to the probe, Some applications are not that bright so we might have to retry a few times before determining whether it's healthy or not.
To help us customize the probes to meet our requirements, the following probe configurations help
initialDelaySeconds: Defines the strategic delay in the number of seconds Kubelet has to wait after the container has started before startup, liveness or readiness probes kick in. Defaults to 0 seconds. The minimum value is 0.periodSeconds: The frequency of probes in other words How often (in seconds) to retry the probe. Default to 10 seconds. The minimum value is 1.timeoutSeconds: Number of seconds after which the probe times out. Defaults to 1 second. The minimum value is 1. For example, as part of the httpGet probe, if we set the timeout Seconds to 60 seconds, the probe would wait for 60 seconds for the URL to respond.successThreshold: Minimum consecutive successes for the probe to be considered successful after having failed. Defaults to 1. Must be 1 for liveness and startup Probes. The minimum value is 1.failureThreshold: The number of times in a row the probe can fail before Kubelet considers the probe/check failed and takes necessary action. In the case of a startup or liveness probe, if at leastfailureThresholdprobes have failed, Kubernetes treats the container as unhealthy and triggers a restart for that specific container. The kubelet takes the setting ofterminationGracePeriodSecondsfor that container into account. For a failed readiness probe, the kubelet continues running the container that failed checks, and also continues to run more probes; because the check failed, the kubelet sets theReadycondition on the Pod tofalse.terminationGracePeriodSeconds: configure a grace period for the kubelet to wait between triggering a shutdown of the failed container, and then forcing the container runtime to stop that container. The default is to inherit the Pod-level value forterminationGracePeriodSeconds(30 seconds if not specified), and the minimum value is 1.
Examples of Kubernetes Probes
Let's look at some examples of how Kubernetes probes can be used in practice.
Liveness Probe
The Liveness probe ensures the health and reliability of the running container and it makes sure that the application stays healthy by running checks.
Liveness Probes support all four types of checks and I have given examples for each one of them.
Liveness Probe - httpGet
Suppose a web application is running in a container that listens on port 8080. You can define a liveness probe that checks if the web application is still responding to requests on that port.
livenessProbe:
  httpGet:
    path: /healthz
    port: 8080
  initialDelaySeconds: 5
  periodSeconds: 10
  timeoutSeconds: 5
  failureThreshold: 3
In this example, the liveness probe sends an HTTP GET request to the /healthz endpoint of the container every 10 seconds. If the probe fails three times in a row, the container will be killed and restarted.
Liveness Probe - exec
Let's suppose your application creates a lock file as soon it starts and the file is available as long the application is running and healthy
You can use the availability of that file to determine the health of the container/application
In Linux, you might do this with simple listing commands like ls /tmp/application.lck
the same you can do with exec check. here is the sample snippet
livenessProbe:
  exec:
    command:
    - ls
    - /tmp/application.lck
  initialDelaySeconds: 5
  periodSeconds: 5
Liveness Probe - gRPC
gRPC is a technology for implementing RPC APIs that uses HTTP 2.0 as its underlying transport protocol.
gRPC is preferred for its security and speed. one of the major differences is HTTP requests are sent as text and can be read and created by humans. RPC messages are encoded with Protobuf by default.
read this article to know more about gRPC and when to use gRPC over HTTP
Here is one example where we are deploying the etcd key-value database and using the gRPC endpoint protocol to ensure the health
apiVersion: v1
kind: Pod
metadata:
  name: etcd-with-grpc
spec:
  containers:
  - name: etcd
    image: registry.k8s.io/etcd:3.5.1-0
    command: [ "/usr/local/bin/etcd", "--data-dir",  "/var/lib/etcd", "--listen-client-urls", "http://0.0.0.0:2379", "--advertise-client-urls", "http://127.0.0.1:2379", "--log-level", "debug"]
    ports:
    - containerPort: 2379
    livenessProbe:
      grpc:
        port: 2379
      initialDelaySeconds: 10
In the preceding snippet, you can see we are connecting to the grpc port 2379 to validate the liveness of the etcd server instance
Liveness Probe - tcpSocket
Just like gRPC, we can use the tcpSocket (or) port to ensure the health of our containers/pods
Let's assume you are running NGINX reverse proxy as a container and you want to ensure it is healthy. While NGINX has its health check pages, which can be enabled. But the simple alternate solution is to ensure that port 80 is listening and accepting connections
Here is the example snippet
apiVersion: v1
kind: Pod
metadata:
  name: nginx
  labels:
    app: nginx
spec:
  containers:
  - name: nginx
    image: registry.k8s.io/nginx
    ports:
    - containerPort: 80
    livenessProbe:
      tcpSocket:
        port: 80
      initialDelaySeconds: 15
      periodSeconds: 20
In the preceding snippet, you can see that we are using tcpSocket to connect to port 80 of nginx to ensure that the nginx is LIVE and healthy
Readiness Probe
As we have seen earlier Readiness probe is to ensure that the POD/Container is ready before it can be added to the service and accept connections.
All the check mechanisms ( httpGet, tcpSocket, gRPC, exec) we have seen earlier can be used the same way in the readiness probe as well. Just by replacing the probe name
Readiness Probe - tcpSocket
Suppose you have a database running in a container that takes some time to start up. You can define a readiness probe that checks if the database is ready to accept connections on port 3306.
readinessProbe:
  tcpSocket:
    port: 3306
  initialDelaySeconds: 30
  periodSeconds: 10
  timeoutSeconds: 5
  failureThreshold: 3
In this example, the readiness probe checks if the container can establish a TCP connection on port 3306 every 10 seconds. If the probe fails three times in a row, the container will be removed from the service endpoints until it passes the readiness probe.
Readiness Probe - exec
We are going to use the same example snippet we have used in the liveness probe with exec check.
In this example, the readiness probe checks if the lock file is present by executing the command ls /tmp/application.lck
If the file is available the application is considered ready otherwise not.
readinessProbe:
  exec:
    command:
    - ls
    - /tmp/application.lck
  initialDelaySeconds: 5
  periodSeconds: 5
Readiness Probe - gRPC
Earlier we have seen an example of gRPC being used to check the health of an etcd database instance. Now we are going to use the same snippet for the readiness probe as well.
apiVersion: v1
kind: Pod
metadata:
  name: etcd-with-grpc
spec:
  containers:
  - name: etcd
    image: registry.k8s.io/etcd:3.5.1-0
    command: [ "/usr/local/bin/etcd", "--data-dir",  "/var/lib/etcd", "--listen-client-urls", "http://0.0.0.0:2379", "--advertise-client-urls", "http://127.0.0.1:2379", "--log-level", "debug"]
    ports:
    - containerPort: 2379
    readinessProbe:
      grpc:
        port: 2379
      initialDelaySeconds: 10
In this example, the readiness probe is connecting to port 2379 on the grpc port to ensure the etcd db instance is ready
Readiness Probe - httpGet
HTTP get check mechanism is a widely used standard to ensure the web application is live and healthy
It is a recommended best practice to have a health check /health URL is inbuilt into all the web applications we design
For some web applications or APIs, we can use the actual home page or feature page or an API endpoint with this httpGet which helps us to ensure the reliability of the application.
In the example, we have seen earlier, for the Liveness Probe with httpGet. All we have to Change is the probe name it is our readiness probe with httpGet is ready
readinessProbe:
  httpGet:
    path: /healthz
    port: 8080
  initialDelaySeconds: 5
  periodSeconds: 10
  timeoutSeconds: 5
  failureThreshold: 3
Startup Probe
Startup Probes are more like Readiness Probe but Startup Probes are invoked during the startup phase of the POD while the readiness Probe come after that.
It is considered a little more efficient and the latest addition to the Kubernetes probes.
You can use all the types of checks with the Startup probe as well.
- exec
- httpGet
- gRPC
- tcpSocket
Here is one example we have given for the HTTP Get for startup probe. But you can use all the previous examples with other probes in the Startup probe as well.
All you have to change is the type of probe.
Suppose you have an application that takes a long time to start up because it needs to perform some initialization tasks. You can define a startup probe that checks if the application has finished starting up by sending an HTTP GET request to a specific endpoint.
startupProbe:
  httpGet:
    path: /init
    port: 8080
  initialDelaySeconds: 60
  periodSeconds: 10
  timeoutSeconds: 5
  failureThreshold: 3
Conclusion
Hope you have learnt, Kubernetes probes and the types of checks and multiple configuration elements with examples.
If you have any questions. please do let me know in the comments section
Cheers
Sarav

Follow me on Linkedin My Profile Follow DevopsJunction onFacebook orTwitter For more practical videos and tutorials. Subscribe to our channel
Signup for Exclusive "Subscriber-only" Content