ALB(Application Load Balancer) Logs are a great asset when it comes to troubleshooting. It provides a finer detail of the HTTP request processed by the ALB and sent to the target.
ALB logs provide various fields and data which are essential to understanding the request flow. You can use it to troubleshoot your application errors, timeouts etc. 4xx and 5xx errors etc.
This can be used for security auditing and security incident post-mortem analysis too.
So this is a must-have for the Production Application Load Balancer.
Once the ALB Logs are enabled, you can ingest the ALB logs into Amazon Athena and start working on the data using SQL queries.
Here is a quick introduction of Athena from the creators themselves.

What is AWS Athena
Amazon Athena is an interactive query service that makes it easy to analyze data directly in Amazon Simple Storage Service (Amazon S3) using standard SQL. With a few actions in the AWS Management Console, you can point Athena at your data stored in Amazon S3 and begin using standard SQL to run ad-hoc queries and get results in seconds.
Athena is serverless, so there is no infrastructure to set up or manage, and you pay only for the queries you run. Athena scales automatically—running queries in parallel—so results are fast, even with large datasets and complex queries.
Check If ALB logs are enabled - Enable if not
To check whether ELB- Elastic Load Balancer has the Logs enabled.
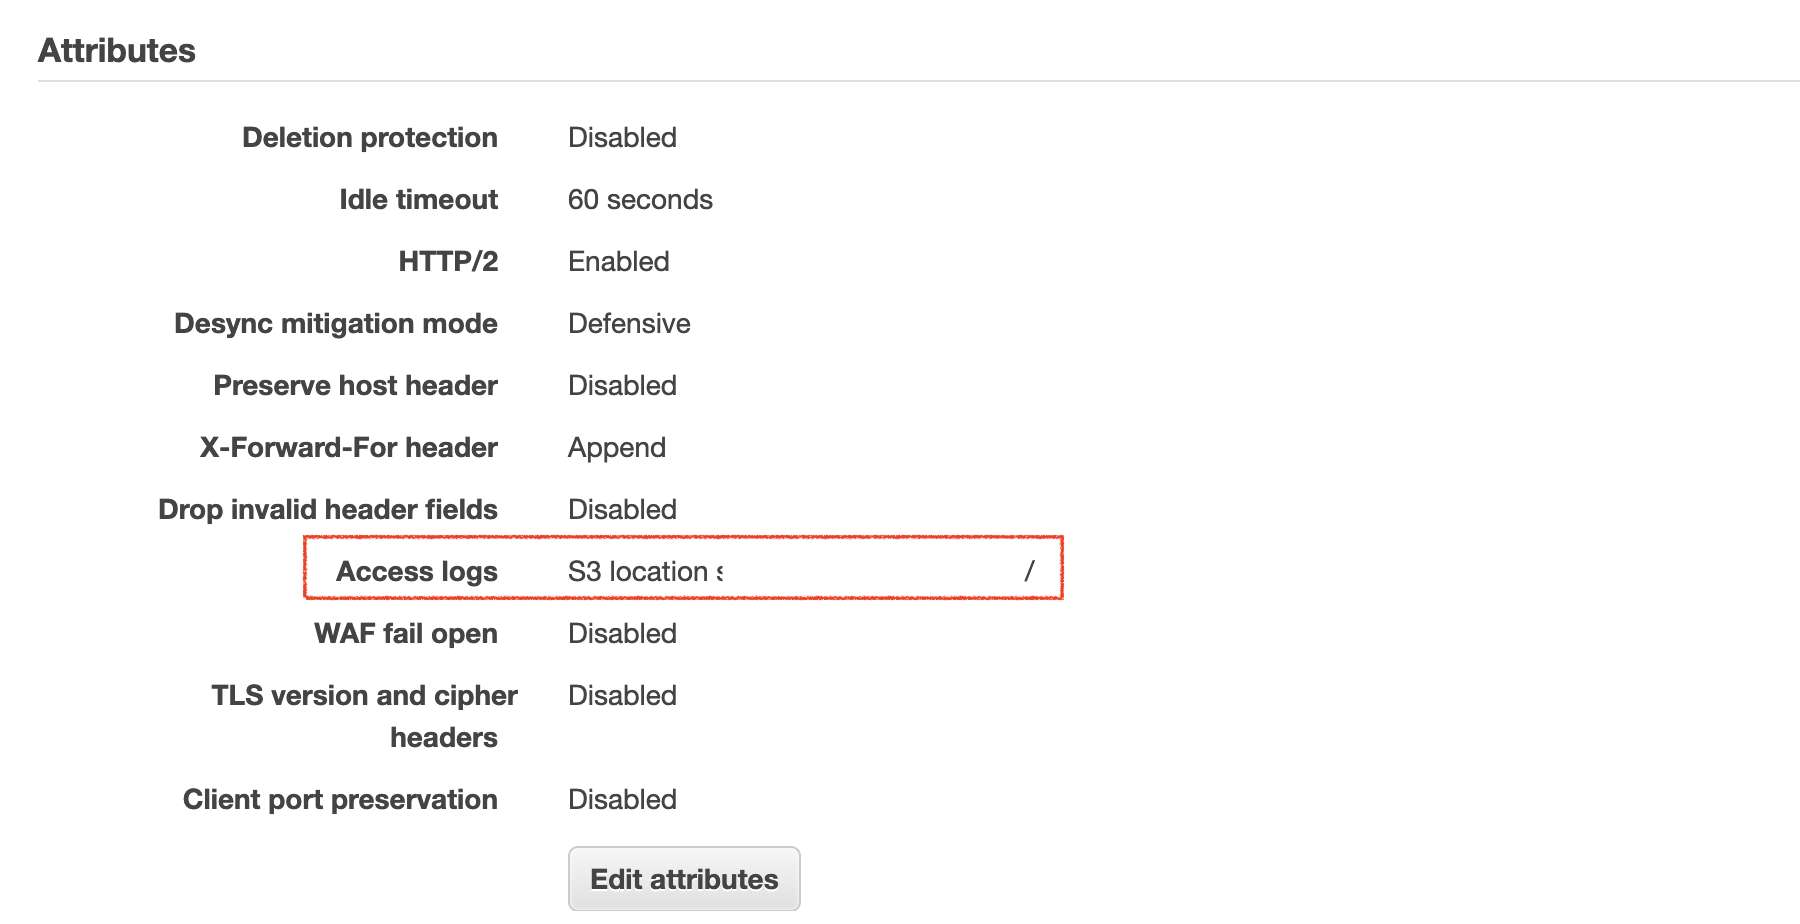
Go to Load Balancer -> Select the Load Balancer -> Check the Attributes section.
Under the attributes section you can see the Access logs attribute.
If the access log is enabled you would find the S3 Location and the S3 bucket name. If not enabled you would see Disabled
In the following screenshot, you can see the Access logs is enabled and the S3 location is shown.
If you have not enabled it yet. Just click on the Edit attributes and enable it
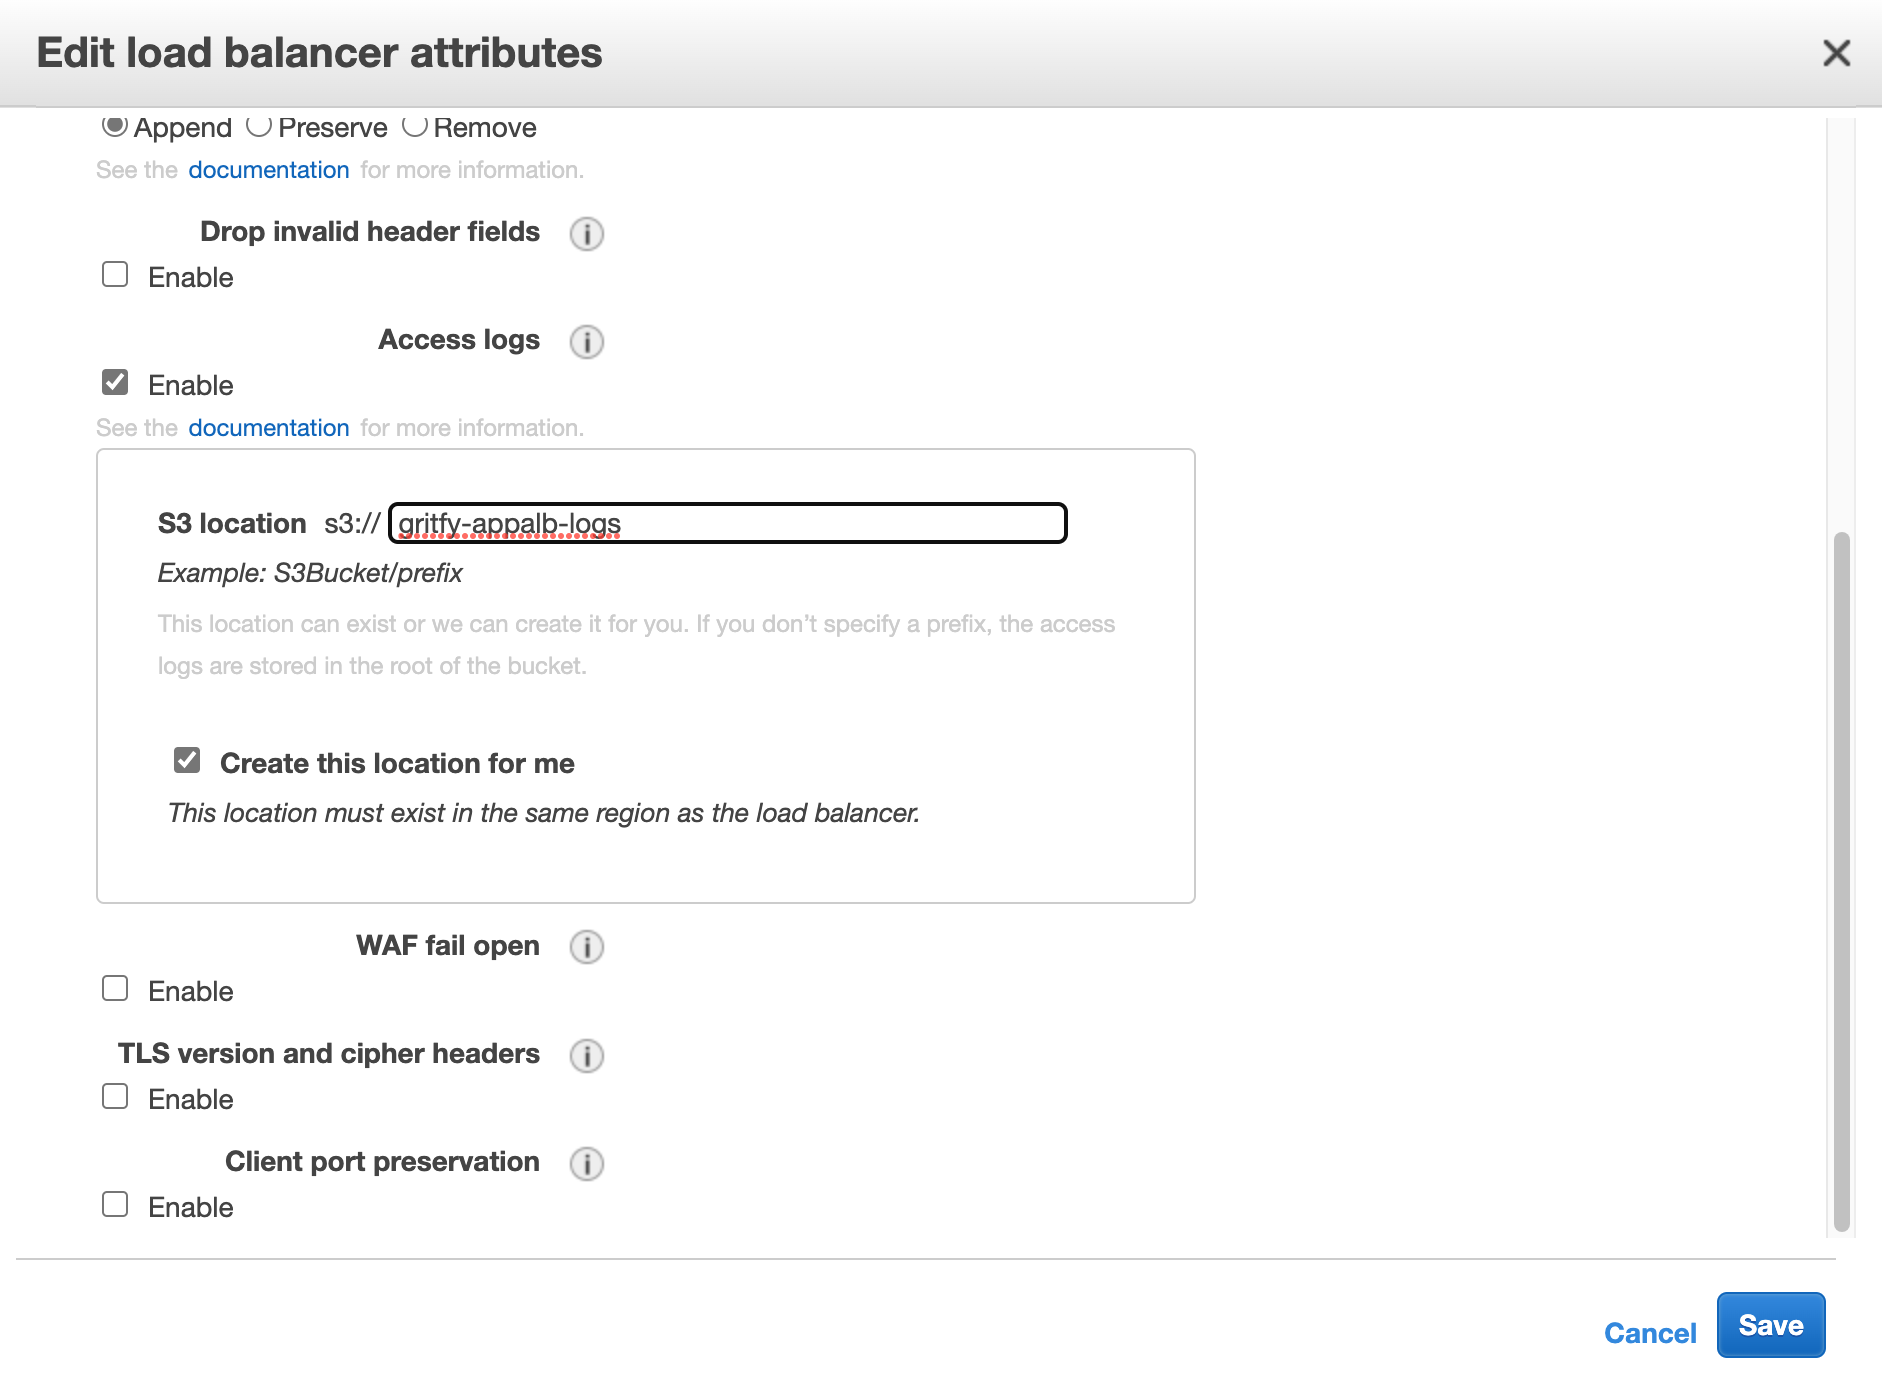
If you use the existing S3 bucket or select the option to let aws create the S3 bucket for you to store the logs.
now you can go to S3 and make sure that the bucket is created and the logs are coming.
You may have to create some traffic and test the ALB to see the log files created.
Ingesting the ALB logs from S3 to AWS Athena
Now you have the ALB logs enabled and the logs are being written to the S3 bucket.
Time to put the logs into Analysis using Athena.
Let us start ingesting the S3 logs into Athena into some table.
Create a table and ingest the logs from S3 bucket
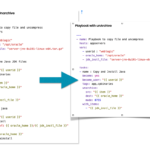
You can go to Athena Query editor and open a new query tab and paste the following SQL query
But you need to replace a few placeholders on the Query
- Account ID
- S3 bucket name
- Region
Ideally, this is the directory structure of how ALB writes the logs in the S3 bucket. You can copy these values from the S3 bucket directory. names itself.
You can optionally change the table name by replacing the alb_logs on the first line of the Query with some other name of your choice.
This query creates the Partitioned table and ingests only the data defined on the projection.day.range field
To know more about these fields and how to create this table without partition etc. refer this article
This Query would work for the Application Load Balancer and Network Load Balancer
Classic Load Balancers would not have certain fields in this list. will see the difference shortly
CREATE EXTERNAL TABLE IF NOT EXISTS alb_logs (
            type string,
            time string,
            elb string,
            client_ip string,
            client_port int,
            target_ip string,
            target_port int,
            request_processing_time double,
            target_processing_time double,
            response_processing_time double,
            elb_status_code int,
            target_status_code string,
            received_bytes bigint,
            sent_bytes bigint,
            request_verb string,
            request_url string,
            request_proto string,
            user_agent string,
            ssl_cipher string,
            ssl_protocol string,
            target_group_arn string,
            trace_id string,
            domain_name string,
            chosen_cert_arn string,
            matched_rule_priority string,
            request_creation_time string,
            actions_executed string,
            redirect_url string,
            lambda_error_reason string,
            target_port_list string,
            target_status_code_list string,
            classification string,
            classification_reason string
            )
            PARTITIONED BY
            (
             day STRING
            )
            ROW FORMAT SERDE 'org.apache.hadoop.hive.serde2.RegexSerDe'
            WITH SERDEPROPERTIES (
            'serialization.format' = '1',
            'input.regex' =
        '([^ ]*) ([^ ]*) ([^ ]*) ([^ ]*):([0-9]*) ([^ ]*)[:-]([0-9]*) ([-.0-9]*) ([-.0-9]*) ([-.0-9]*) (|[-0-9]*) (-|[-0-9]*) ([-0-9]*) ([-0-9]*) \"([^ ]*) (.*) (- |[^ ]*)\" \"([^\"]*)\" ([A-Z0-9-_]+) ([A-Za-z0-9.-]*) ([^ ]*) \"([^\"]*)\" \"([^\"]*)\" \"([^\"]*)\" ([-.0-9]*) ([^ ]*) \"([^\"]*)\" \"([^\"]*)\" \"([^ ]*)\" \"([^\s]+?)\" \"([^\s]+)\" \"([^ ]*)\" \"([^ ]*)\"')
            LOCATION 's3://your-alb-logs-directory/AWSLogs/<ACCOUNT-ID>/elasticloadbalancing/<REGION>/'
            TBLPROPERTIES
            (
             "projection.enabled" = "true",
             "projection.day.type" = "date",
             "projection.day.range" = "2022/01/01,NOW",
             "projection.day.format" = "yyyy/MM/dd",
             "projection.day.interval" = "1",
             "projection.day.interval.unit" = "DAYS",
             "storage.location.template" = "s3://your-alb-logs-directory/AWSLogs/<ACCOUNT-ID>/elasticloadbalancing/<REGION>/${day}"
            )
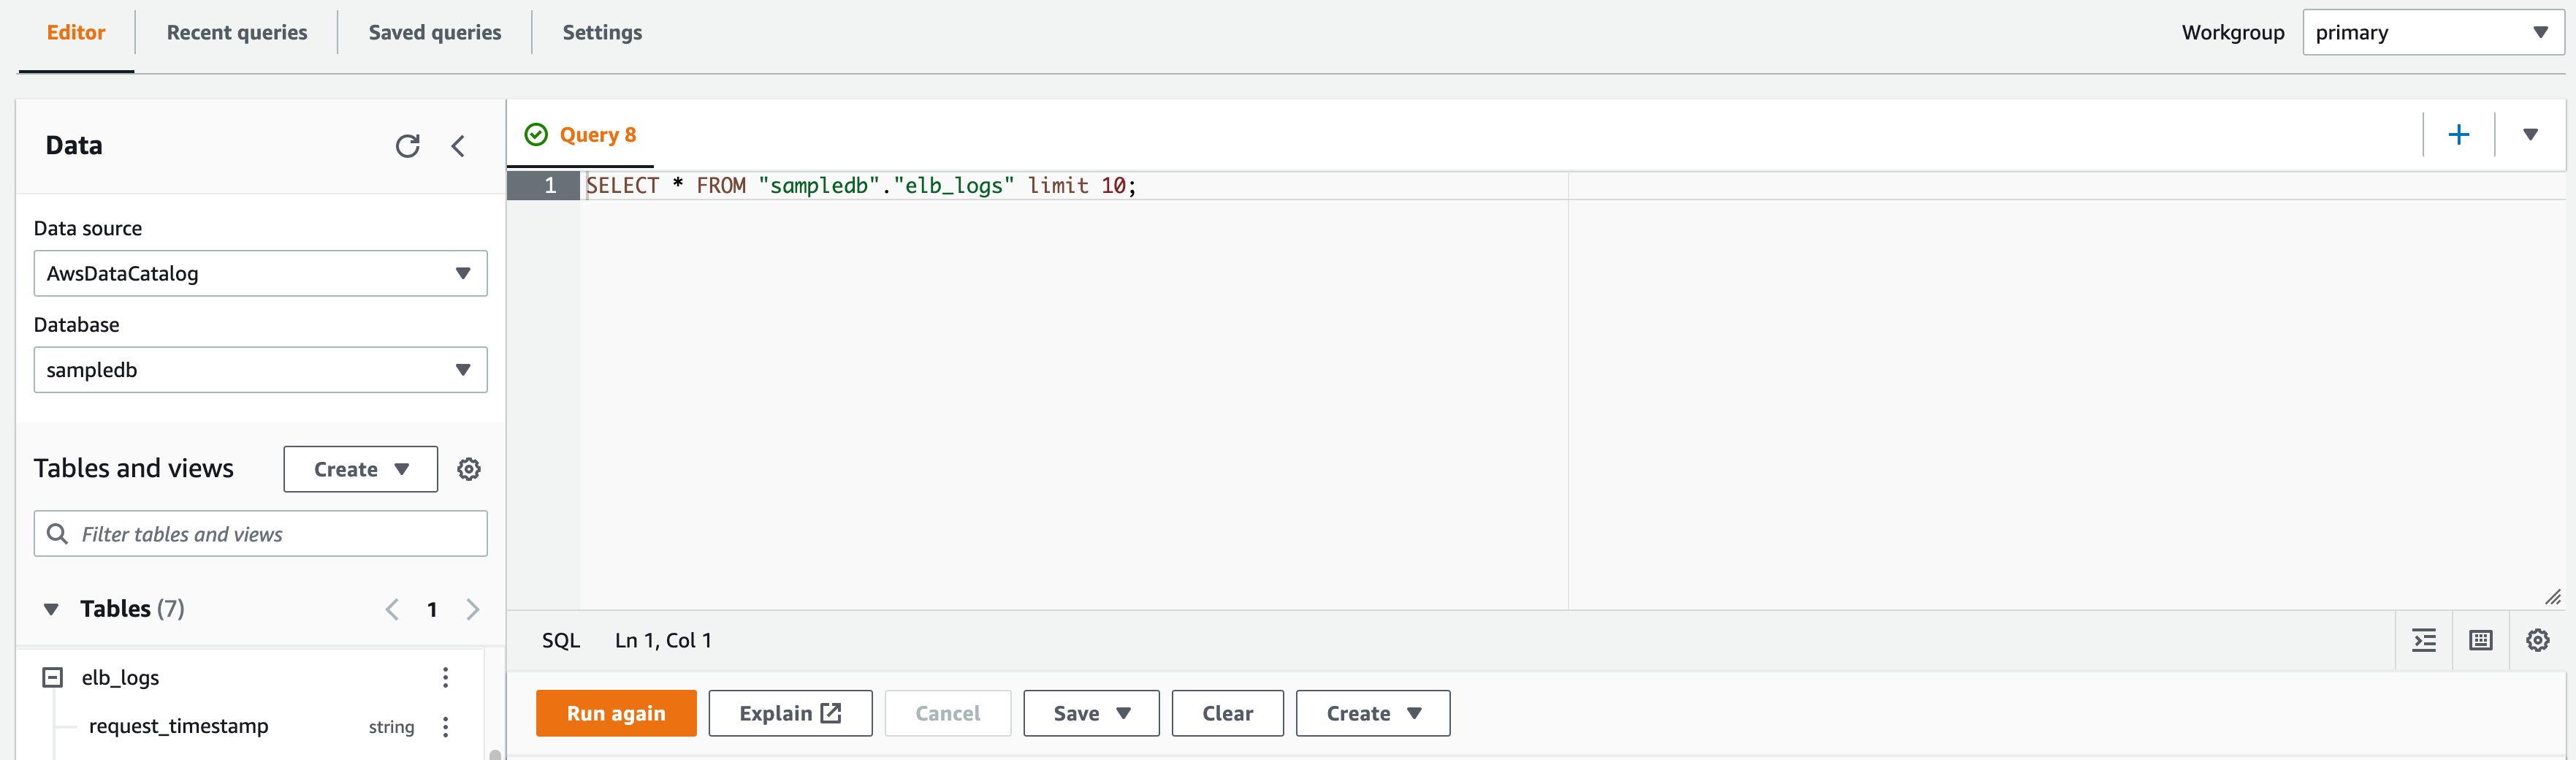
Once the table is created, you would be able to see it on the left navigation pane of the query editor under Tables
you can start executing some simple SQL queries to test or preview the table
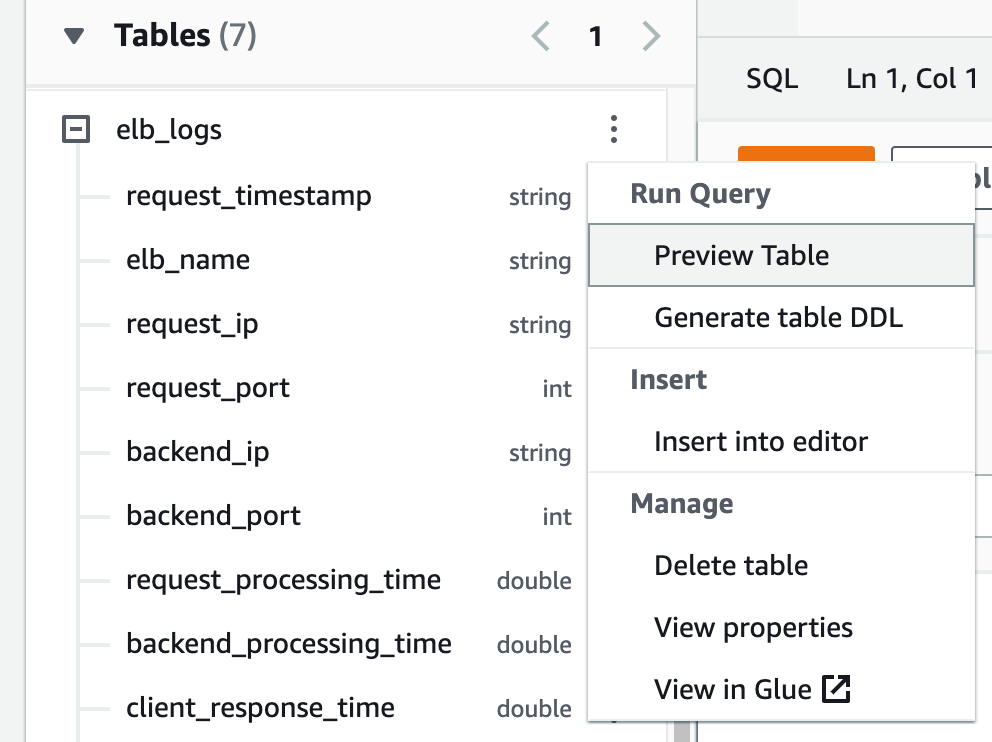
How to preview the table in Athena
The easy way to preview the table is to click on the hamburger button adjacent to your table and click on the Preview Table option
Query Editor and How to Edit, Write and Save Queries
I hope now you get a glimpse of it, as soon as you click on the preview table
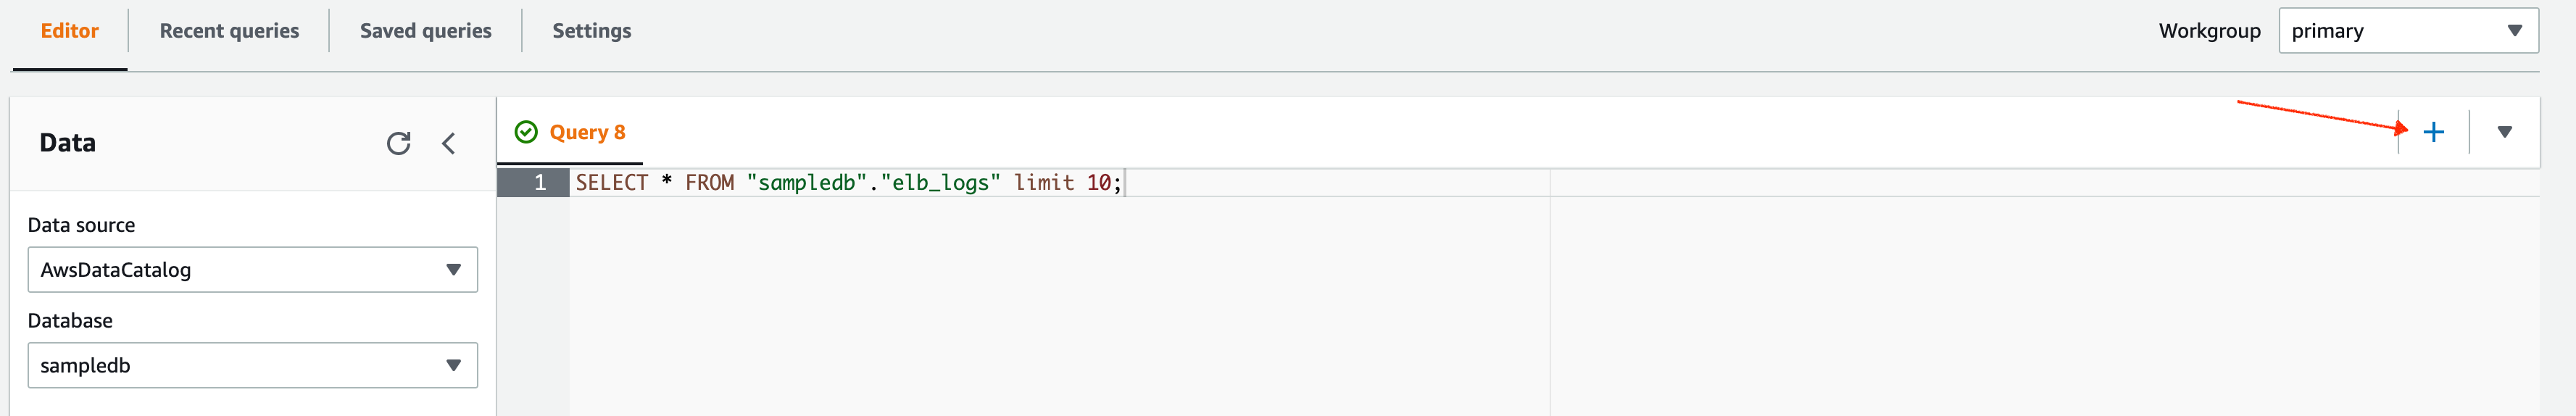
A new Query tab, would be opened with the following SQL query
Note: The Query Tab would have auto incremented numbers like Query1, Query2 ... QueryN
You can start editing the Query and write your own SQL queries on the same tab.
Or create a new Tab and write your Queries. by clicking on the + sign present the Name bar
You can Save your query using Save button shown below the Query panel. Once saved it would be available on the saved queries
By default, all the executed queries would be available in the recent queries tab. You can re-launch it from there too.
You can select a portion/part of the query on the query editor by highlighting it and clicking on the Run again
Otherwise, the entire query on the query editor would be executed by default.
Now you know how Athena works and how to save, edit, write and execute the queries.
Let us give you some Query examples to keep it handy for your troubleshooting
Application Load Balancer vs Classic Load Balancer - Fields Comparison
As we have mentioned earlier, the fields available would vary for the Application Load balancer and Classic Load Balancer.
Here is the list of fields available for Classic Load Balancer
timestamp           	string
elb_name            	string
request_ip          	string
request_port        	int
backend_ip          	string
backend_port        	int
request_processing_time	double
backend_processing_time	double
client_response_time	double
elb_response_code   	string
backend_response_code	string
received_bytes      	bigint
sent_bytes          	bigint
request_verb        	string
url                 	string
protocol            	string
user_agent          	string
ssl_cipher          	string
ssl_protocol        	string
Here is the list of fields available for Application Load Balancer
type                	string
time                	string
elb                 	string
client_ip           	string
client_port         	int
target_ip           	string
target_port         	int
request_processing_time	double
target_processing_time	double
response_processing_time	double
elb_status_code     	string
target_status_code  	string
received_bytes      	bigint
sent_bytes          	bigint
request_verb        	string
request_url         	string
request_proto       	string
user_agent          	string
ssl_cipher          	string
ssl_protocol        	string
target_group_arn    	string
trace_id            	string
domain_name         	string
chosen_cert_arn     	string
matched_rule_priority	string
request_creation_time	string
actions_executed    	string
redirect_url        	string
lambda_error_reason 	string
target_port_list    	string
target_status_code_list	string
classification      	string
classification_reason	string
Athena SQL Queries for ELB troubleshooting
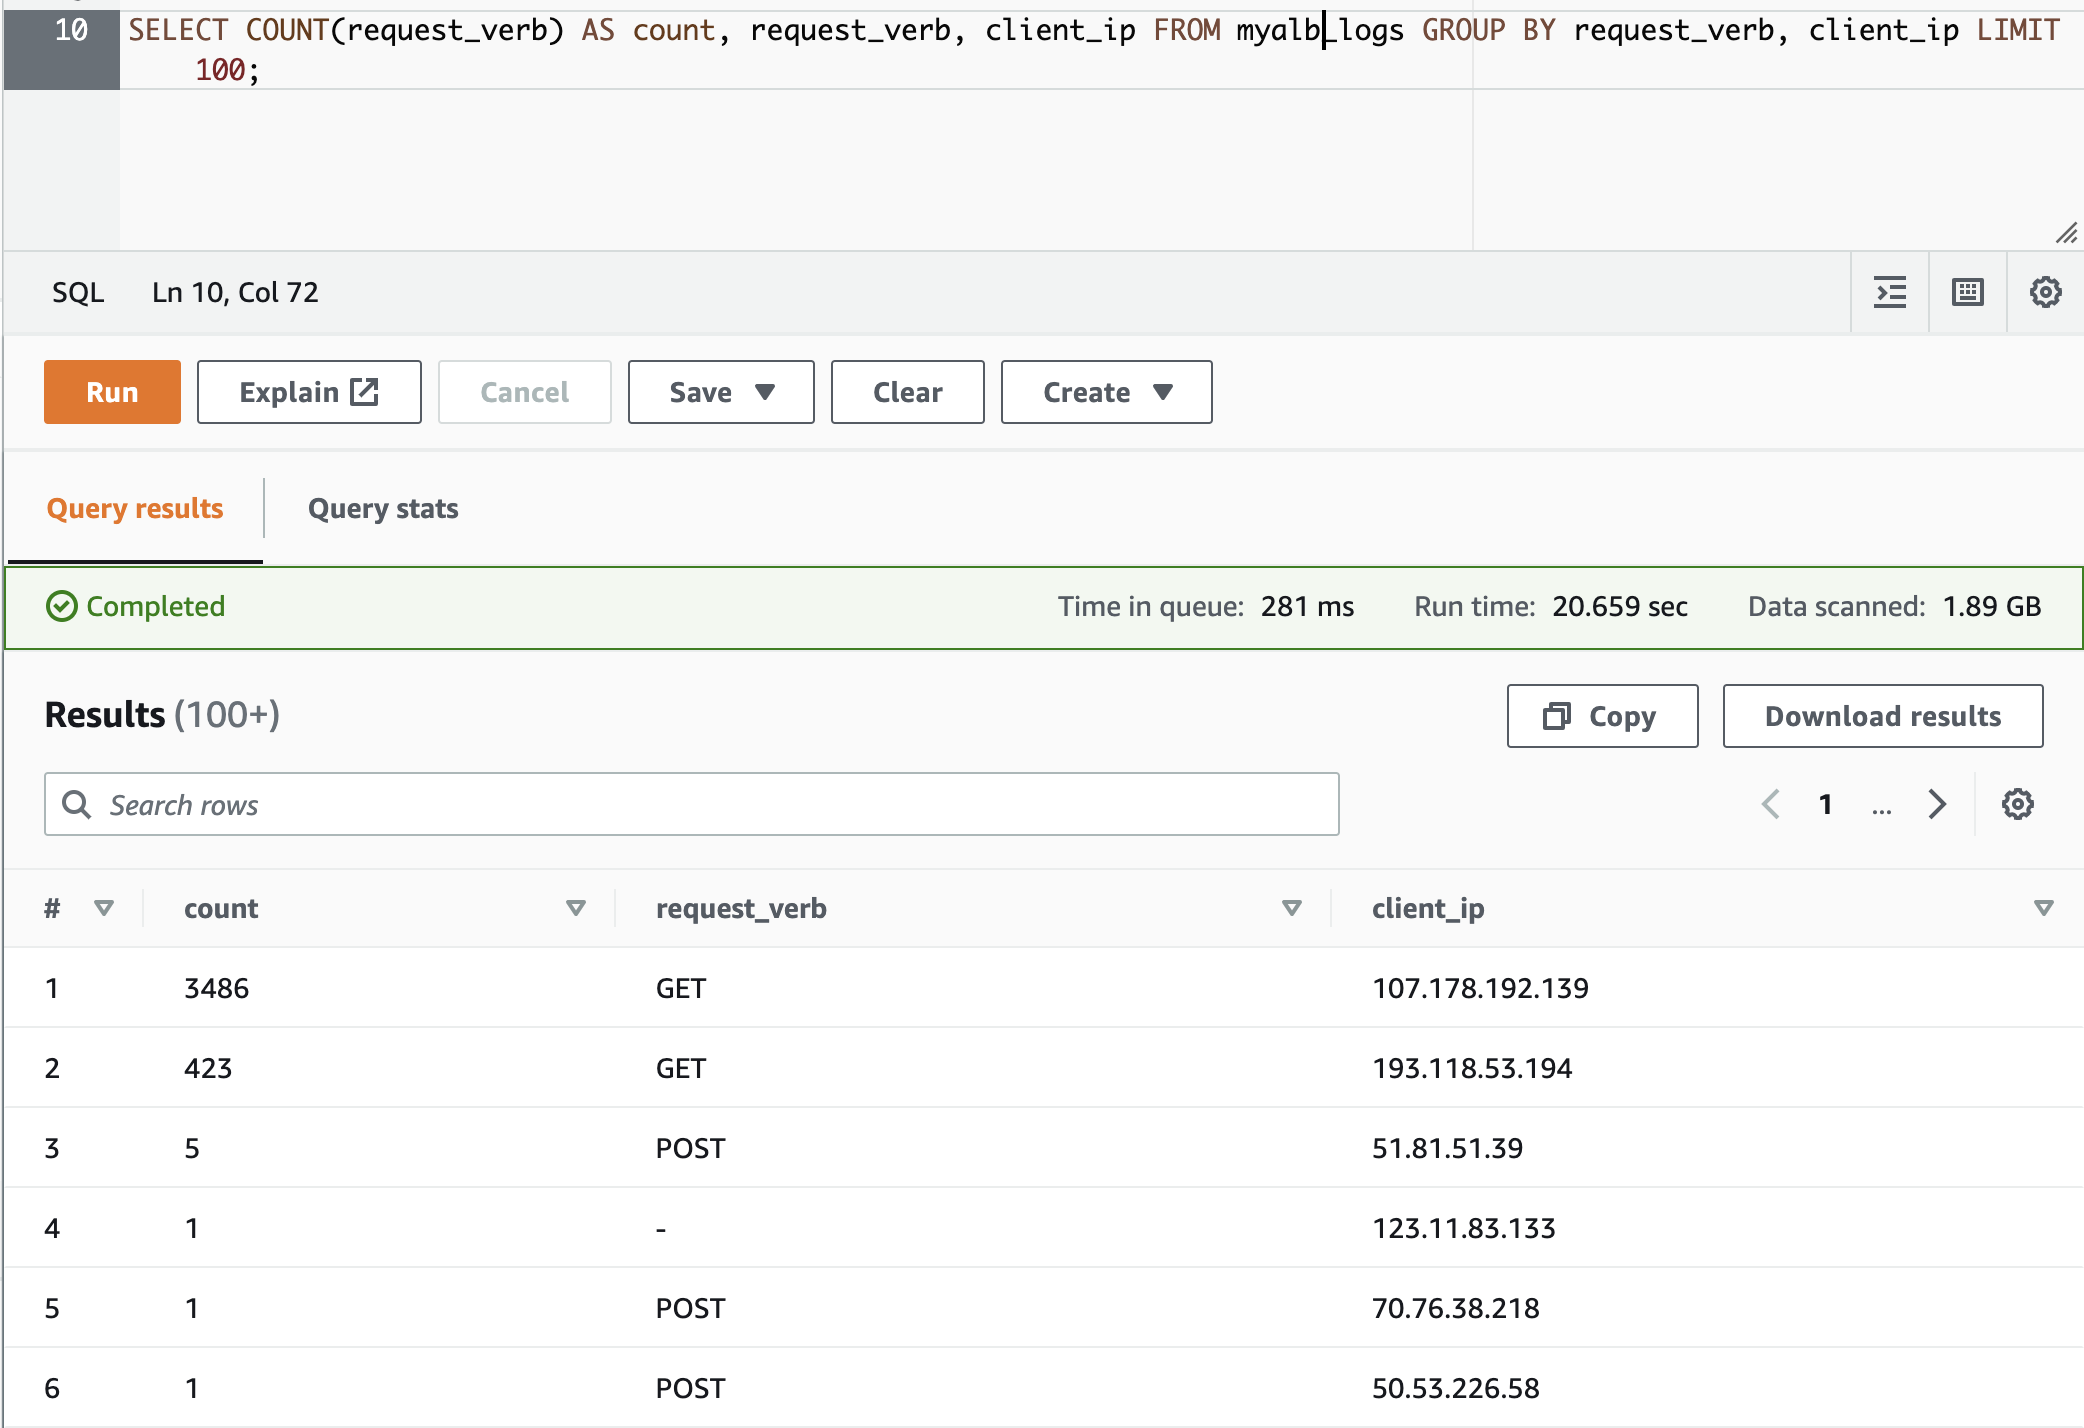
Requests grouped by HTTP method and client IP
The following query counts the number of HTTP requests received by the load balancer grouped by the client IP address:
SELECT COUNT(request_verb) AS
 count,
 request_verb,
 client_ip
FROM alb_logs
GROUP BY request_verb, client_ip
LIMIT 100;
Here is the output of this preceding SQL Query
Filter requests by HTTP method GET, POST, OPTIONS etc
Here is the SQL query to filter only POST requests
SELECT Count(request_verb) AS count,
       request_verb,
       client_ip
FROM   alb_logs
WHERE request_verb = 'POST'
GROUP  BY request_verb,
          client_ip
LIMIT  100;
You can remove the limit 100 or increase it if you want more data
This query can be modified to filter other HTTP request methods like GET, OPTIONS, DELETE, HEAD etc
 – HTTP OPTIONS
SELECT Count(request_verb) AS count,
       request_verb,
       client_ip
FROM   alb_logs
WHERE request_verb = 'OPTIONS'
GROUP  BY request_verb,
          client_ip
LIMIT  100;

 – HTTP GET
SELECT Count(request_verb) AS count,
       request_verb,
       client_ip
FROM   alb_logs
WHERE request_verb = 'GET'
GROUP  BY request_verb,
          client_ip
LIMIT  100;

 – HTTP DELETE
SELECT Count(request_verb) AS count,
       request_verb,
       client_ip
FROM   alb_logs
WHERE request_verb = 'DELETE'
GROUP  BY request_verb,
          client_ip
LIMIT  100;
Filter Requests based on HTTP Status code 200, 400, 5xx
Before we see the query, you need to understand that there are two status codes available per each request
- elb_status_code
- target_status_code
elb_status_code is the status code returned by the ELB in case of no response from the target group or backend. All other times it would match the target_status_code
target_status_code is the status code returned by the backend Application.
Why both status code is necessary ?.
Let's suppose ELB time out is configured as 60 seconds and the backend is taking more time to respond. the target_status_code would be empty as the backend has not responded yet and the elb close the connect with status 504.
In scenarios like this. target_status_code and elb_status_code both are crucial
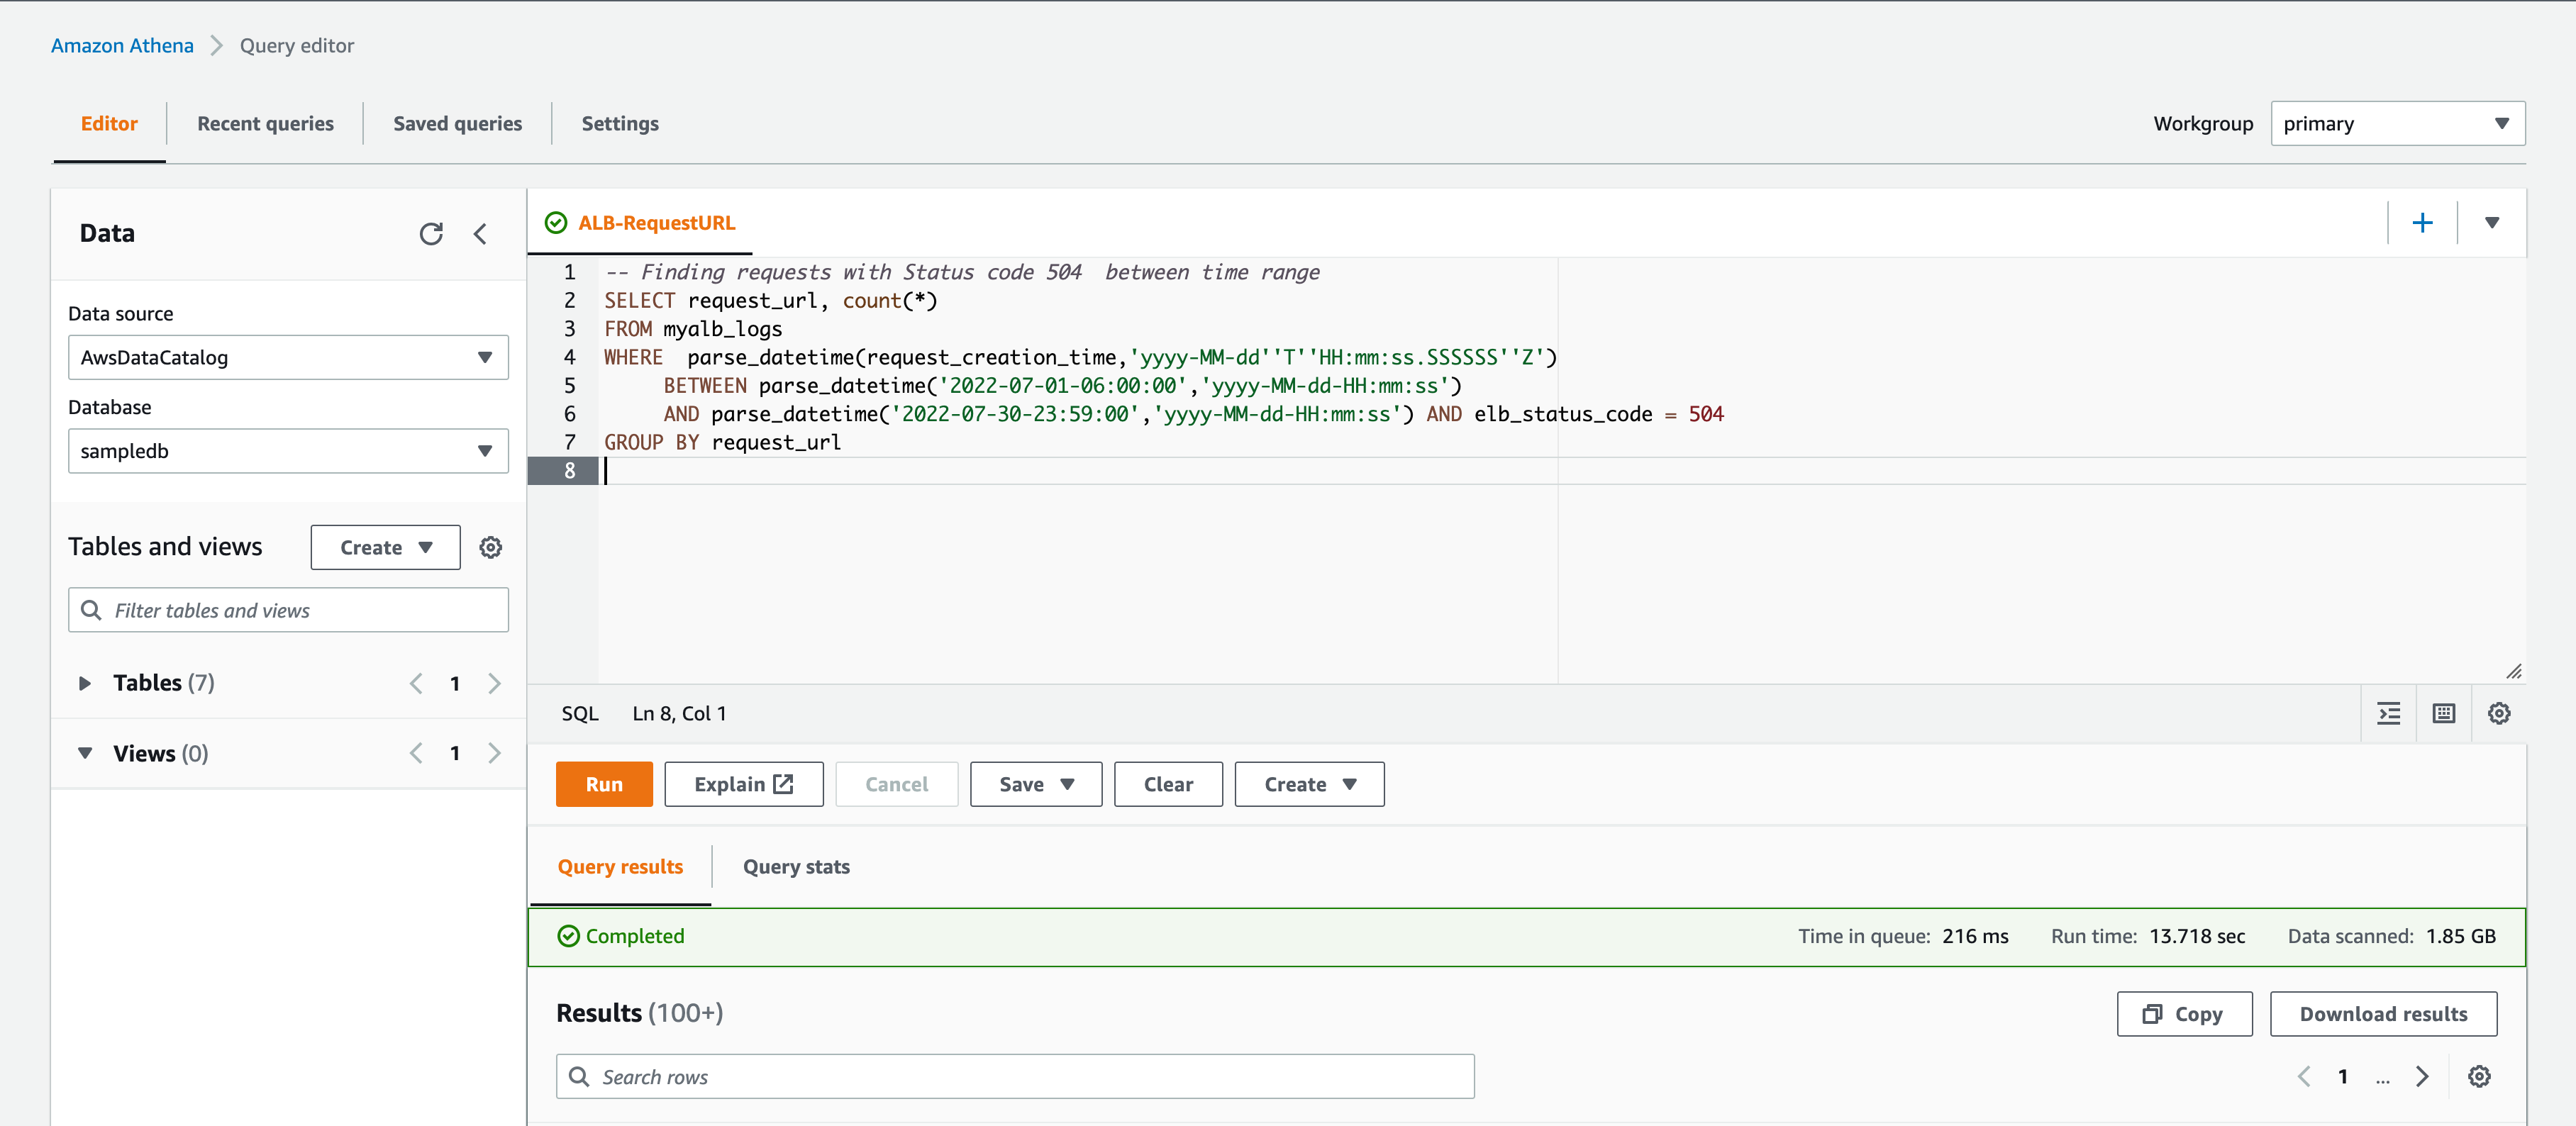
Here is the SQL query to find the requests with 5xx response.
This would be helpful to find your endpoints which are throwing 5xx errors the most.
 – SQL query to find requests with 5xx status codes
SELECT request_url,
       count(elb_status_code)
FROM   alb_logs
WHERE  elb_status_code BETWEEN 500 and 599
group by request_url
Here is the query that helps to find out the 2xx and 4xx response codes
 – SQL query to find requests with 4xx status codes
SELECT request_url,
       count(elb_status_code)
FROM   alb_logs
WHERE  elb_status_code BETWEEN 400 and 499
group by request_url

 – SQL query to find requests with 2xx status codes
SELECT request_url,
       count(elb_status_code)
FROM   alb_logs
WHERE  elb_status_code BETWEEN 200 and 299
group by request_url
Adding time range to the SQL Query - Find the top 10 users within time range
So far we have seen SQL Queries with no time range specification. Let's suppose you want to find out which users/IPs are using your service the most in a specific time range.
You need to use the time range in your SQL query.
Just like any other SQL query. It's the simple Start time and end time combined with between clause.
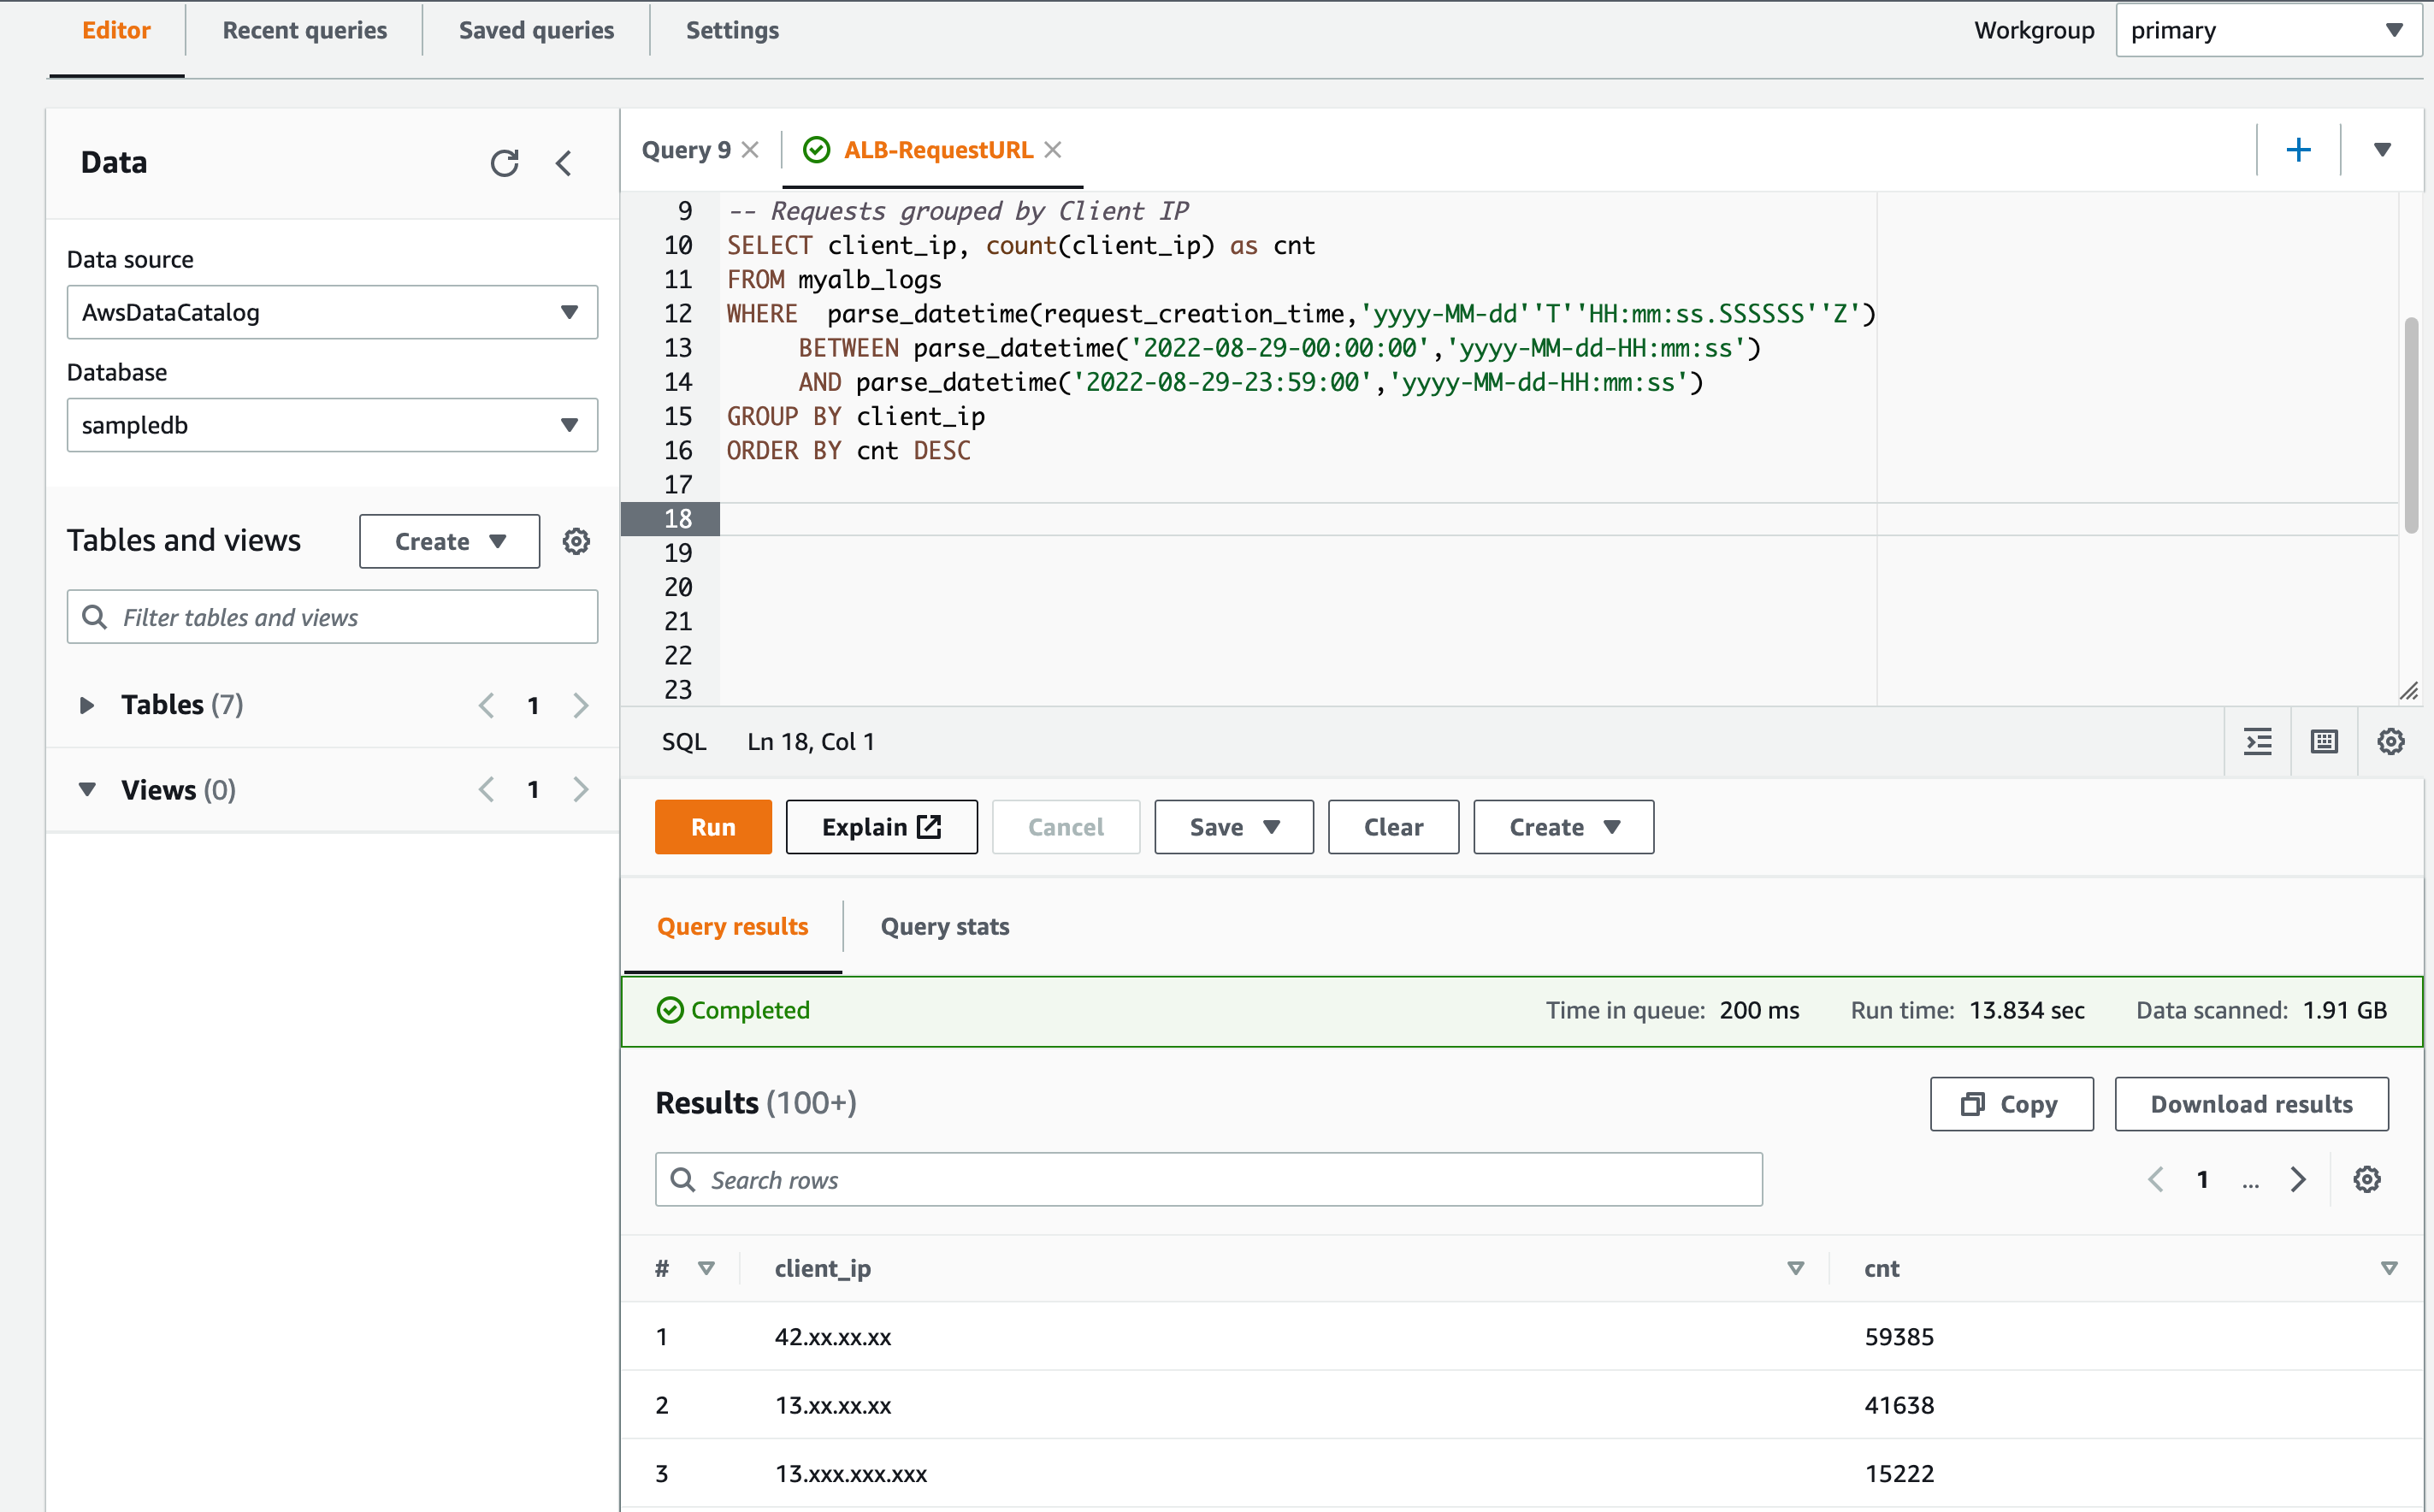
Here is a query to find out which IP has used the services or hit the LB the most in the 24-hour time range.
 – Requests grouped by Client IP
SELECT client_ip, count(client_ip) as cnt
FROM myalb_logs
WHERE  parse_datetime(request_creation_time,'yyyy-MM-dd''T''HH:mm:ss.SSSSSS''Z')
     BETWEEN parse_datetime('2022-08-29-00:00:00','yyyy-MM-dd-HH:mm:ss')
     AND parse_datetime('2022-08-29-23:59:00','yyyy-MM-dd-HH:mm:ss')
GROUP BY client_ip
ORDER BY cnt DESC
Here is the execution output. I have masked the IP address for security reasons.
Deep Dive into the user pattern - Finding the top 10 URLs used by the client IP / user
In the previous example we have found out who are our top 10 customers/users by their total usage
Next on our list is to find out what endpoints or URLs they (clients) use most.
Here is the query to find out the top 10 most used endpoints/URLs of the customer with the client_ip 13.xxx.xxx.xxx
You can use this query and make modifications to find out the entire access log of some IP / user
 – Top 10 requests per IP
SELECT request_url, client_ip, count(client_ip) as cnt
FROM myalb_logs
WHERE client_ip = '13.xxx.xxx.xxx'
AND parse_datetime(request_creation_time,'yyyy-MM-dd''T''HH:mm:ss.SSSSSS''Z')
BETWEEN parse_datetime('2022-08-29-00:00:00','yyyy-MM-dd-HH:mm:ss')
AND parse_datetime('2022-08-29-23:59:00','yyyy-MM-dd-HH:mm:ss')
GROUP BY client_ip, request_url
ORDER BY cnt DESC
LIMIT 10
Find Slow endpoints taking more processing time using AWS Athena
Here is one more Query where use the request_processing_time field of ALB logs to find out which request is taking more time.
In other words, What are the slow URLs/services in the ALB
Here is the SQL Query to find out
SELECT request_url, AVG(request_processing_time) as avg_response, COUNT(request_url) as cnt
FROM myalb_logs
WHERE parse_datetime(request_creation_time,'yyyy-MM-dd''T''HH:mm:ss.SSSSSS''Z')
     BETWEEN parse_datetime('2022-08-24-00:00:00','yyyy-MM-dd-HH:mm:ss')
     AND parse_datetime('2022-08-24-23:59:00','yyyy-MM-dd-HH:mm:ss')
GROUP BY request_url
ORDER BY avg_response DESC
In this query, we are taking the Average response of the request URL and also showing the count, of how many requests have been taken into consideration.
This would be helpful for finding the slowest endpoints behind the ALB and you can fix it for a good customer experience.
Athena SQL query group by 5 minutes time frame - Usage Pattern / Rate limit
This example is a real-time use case to understand your user's behaviour and to find out some baseline numbers for usage.
Let's say you want to implement a Rate limit on the Application Load Balancer with AWS WAF and you want to know what is the current usage pattern
How many users are reaching the application every 5 minutes?
Who are our Highly contributing and heavy usage customers? What is the usage pattern of our customers? Is there a DDOS attack or Burst requests from any customer?
All these questions can be answered with the data you are going to collect
 – Check 5 minute Requests sort by time 00 to 23:50 –

SELECT from_unixtime(floor(to_unixtime(from_iso8601_timestamp(request_creation_time)) / 300 )*300) as timekey, client_ip, count(client_ip) as cnt
FROM "sampledb"."myalb_logs"
WHERE parse_datetime(request_creation_time,'yyyy-MM-dd''T''HH:mm:ss.SSSSSS''Z')
     BETWEEN parse_datetime('2022-09-30-00:00:00','yyyy-MM-dd-HH:mm:ss')
     AND parse_datetime('2022-09-30-23:59:00','yyyy-MM-dd-HH:mm:ss')
GROUP BY from_unixtime(floor(to_unixtime(from_iso8601_timestamp(request_creation_time)) / 300 )*300) , client_ip
ORDER BY timekey, client_ip DESC

 – Check 5 minute Requests sort by Request Count –

SELECT from_unixtime(floor(to_unixtime(from_iso8601_timestamp(request_creation_time)) / 300 )*300) as timekey, client_ip, count(client_ip) as cnt
FROM "sampledb"."myalb_logs"
WHERE parse_datetime(request_creation_time,'yyyy-MM-dd''T''HH:mm:ss.SSSSSS''Z')
     BETWEEN parse_datetime('2022-09-01-00:00:00','yyyy-MM-dd-HH:mm:ss')
     AND parse_datetime('2022-09-30-23:59:00','yyyy-MM-dd-HH:mm:ss')
GROUP BY from_unixtime(floor(to_unixtime(from_iso8601_timestamp(request_creation_time)) / 300 )*300) , client_ip
ORDER BY cnt DESC

 – Check 5 minute Requests For Single User IP –

SELECT from_unixtime(floor(to_unixtime(from_iso8601_timestamp(request_creation_time)) / 300 )*300) as timekey, client_ip, count(client_ip) as cnt
FROM "sampledb"."myalb_logs"
WHERE client_ip = '13.**.**.105' AND parse_datetime(request_creation_time,'yyyy-MM-dd''T''HH:mm:ss.SSSSSS''Z')
     BETWEEN parse_datetime('2022-09-01-00:00:00','yyyy-MM-dd-HH:mm:ss')
     AND parse_datetime('2022-09-30-23:59:00','yyyy-MM-dd-HH:mm:ss')
GROUP BY from_unixtime(floor(to_unixtime(from_iso8601_timestamp(request_creation_time)) / 300 )*300) , client_ip
ORDER BY cnt DESC
I have written three queries for different use cases
- Requests count for all clients grouped by every 5 minutes
- Find the request counts of all clients based on the 5-minute usage. sort Higher to lower
- Find the usage pattern of a single client_ip (user)
All these data would help us to retrospect our application and to set some fair usage policy and rate limiting.
Hope this helps
Find the requests closed by the Client abruptly - HTTP status code 499 or 460
At times, when you are trying to troubleshoot a user's session, you might find a status code 460 on the ALB logs, It is a response of ALB to indicate that the client has closed the connection
This is like the nginx 499 status code to indicate that the client has closed the connection
In a system architecture where ALB and NGINX both are used together. when the client has closed the connection due to network issues or some browser issues. you might see 499 at the nginx level and 460 at the alb level.
Here is the diagram I have created, that represents this scenario
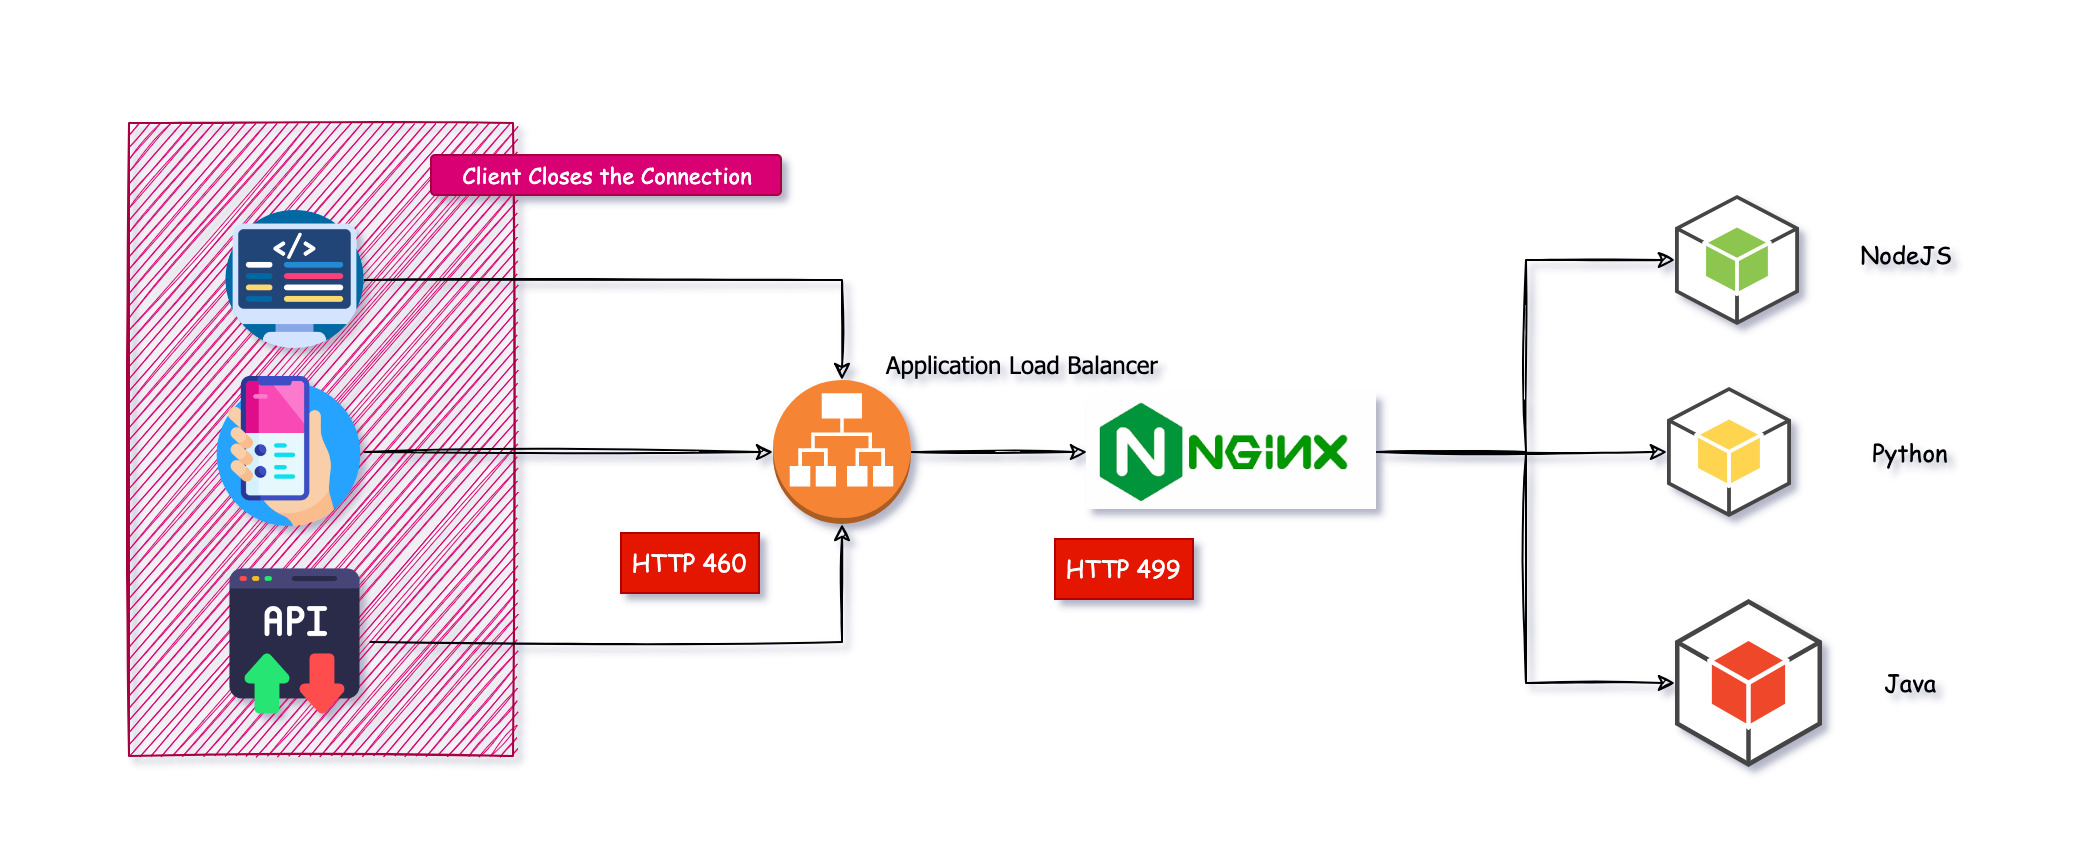
you can see when the client closes the connection. ALB responds with 460.
You can use the following ALB Athena SQL query to find such client-closed connections with alb response code 460
SELECT request_url, client_ip, elb_status_code, target_status_code, count(request_url) as totalrequests FROM "sampledb"."alblogs"
WHERE elb_status_code = 460 AND
parse_datetime(request_creation_time,'yyyy-MM-dd''T''HH:mm:ss.SSSSSS''Z')
     BETWEEN parse_datetime('2022-12-01-00:00:00','yyyy-MM-dd-HH:mm:ss')
     AND parse_datetime('2022-12-08-23:59:00','yyyy-MM-dd-HH:mm:ss') AND
request_url like '%/some/pattern/to/search%'
GROUP BY elb_status_code,request_url, client_ip, elb_status_code, target_status_code
ORDER by totalrequests desc
In this query, we are searching for a URL pattern as well as a status code between the time range.
There are more SQL Queries. Coming up
I know we have covered only a few SQL queries/examples to show the capability of ALB logs and Athena.
But there are various fields that we are yet to explore and the possibility is huge.
So we will try to add more examples to this article consistently.
You can comment on your favourite/Handy Athena SQL queries for SQL troubleshooting and get it featured here.
Hope this helps.
Cheers
Sarav

Follow me on Linkedin My Profile Follow DevopsJunction onFacebook orTwitter For more practical videos and tutorials. Subscribe to our channel
Signup for Exclusive "Subscriber-only" Content