The Overview
Administrating and Managing Weblogic is easy if you have the right tools in place and the knowledge of the existing features what weblogic is already bundled with. In this article, we are going to see one such feature, Which I was not even aware sometimes ago.
As an Administrator, The logs are an essential and indispensable tool or data for us to understand both what happened and what is the root cause.
We most often, get these complaints from the QA/DEV teams or from the Customer that the processing of a particular URI/request is taking a long time than usual.
There could be various reasons for this to happen we know, but the first and foremost thing is to identify if weblogic is causing this. In enterprise architecture, the problem could be anywhere like Network latency, F5, Apache, Weblogic Plugin etc.
We are going to see how to identify if weblogic is taking a long time to process the request by making it print or log the time taken to complete each incoming request to the JVM/instance, This way we can avoid lot of confusions and drive the troubleshooting efforts in the right direction
Weblogic Time Taken to process the request
As mentioned above, we are going to make weblogic print the processing time of each request in the access log of an application server instance(managed/admin).
We can do this with a Special Directive or a logging field of the HTTP access log. the field name is time-taken
We have given the list of steps you can do in the admin console to enable this time-taken field in the JVM access log.
Steps to enable time-taken (or) processing time field in Weblogic Access log
- Access the Administration Console by pointing your web browser to http://localhost:7001/console.
- Click on the Lock & Edit button to start a new edit session.
- Expand the Environment tree on the left and then click on Servers.
- Click on the server name you want to enable this logging for ( in my case it is mwiServer1)
- Go to the Logging tab and then to the HTTP tab.
- Click on the Advanced link to open the advanced options.
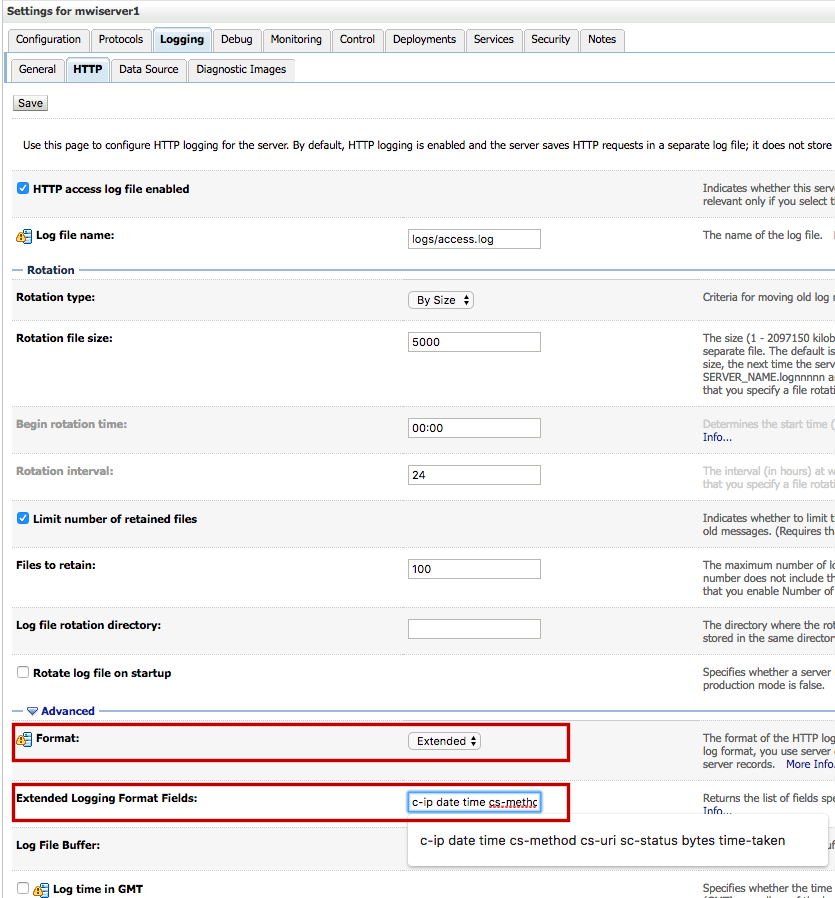
- Select the Extended option from the Format drop-down menu.
- Type
c-ip date time cs-method cs-uri sc-status bytes time-takenin Extended Logging Format Fields and click on the Save button. - Click on the Activate Changes button to finish.
- Repeat the preceding steps for other managed servers you wish to do the same task.
The Preceding Snapshot could give some Clarity where this has to be done.
Sample Log Generated
I have an application named Test Web Service installed into mwiServer1, It is a Simple SOAP web service and Snoop Servlet web application. You can more about that from here
When we are accessing the End Point of the application we supposed to get the Processing Time in the Access logs.
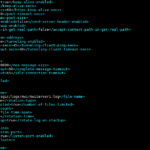
aksarav@middlewareinventory:/apps/oracle-weblogic/domains/mwidomain/servers/mwiServer1/logs$ cat access.log
#Version:	1.0
#Fields:	date time cs-method cs-uri sc-status time-taken
#Software:	WebLogic
#Start-Date:	2019-02-15	11:19:18
2019-02-15	11:19:18	GET	/TestWebService/	200	66.195
2019-02-15	11:19:18	GET	/favicon.ico	404	0.004
2019-02-15	11:22:32	GET	/TestWebService/	200	3.516
You can see the last field is the time taken to process the request. This way we can know whether weblogic has made the delay or not.
Based on this finding, you can proceed further to drive your troubleshooting efforts on the right track.
Hope this helps. Thanks for reading.
Cheers
Sarav AK