There might be times where we might wonder what process is consuming all the system memory or CPU. We invest a lot of time debugging it and looking at the JMX graphs and then we finally find a bug in the code and fix it for good.
On the other hand, there are times where we want to test if our system can uphold the memory requirements of the application.
Or be puzzled with various questions like
- How our Garbage Collection setting work in our Application servers like Weblogic, Websphere, Tomcat, JBoss etc.
- Should we use
ConcurrentGCorParallelGC. which one is efficient and how to test it etc.
Or simply we want to test some Out Of Memory alerting feature and waiting for our properly functioning application to starve like an evil person.
Well. I have been through all these scenarios in the past decade I have spent in IT.
Enough of ice breakers. So what is the objective here?
Objective
The objective of this article is to present and discuss the CPU and Memory Consuming WebApp for Java J2EE containers and Application servers like tomcat, jboss, Websphere, weblogic
So what is it and how it works and what problem it is going to solve?. Let me answer all of them
What is it: A Web Application (WAR file) for consuming CPU and Memory on the server wherever deployed
How it works: Once deployed and ready, You can create CPU and memory consuming threads from the UI. the app would create threads with specified interval until the maximum number of threads reach.
Use cases:
These are the use cases I could think of but it is not limited to this.
- To test your JVM how it handles the load
- You can test which GC policy is effective and troubleshoot the GC issues
- Create CPU hogging threads and test your CPU performance
- Creating OutOfMemory Errors to test your ON OutOfMemory events or alerting system
- Simply create graphs and observe how CPU and Memory Usage reflect in JMX monitors like JConsole, VisualVM etc
- Test your monitoring tool (or) APM and an alerting system like Solarwinds, Splunk, ELK, AppDynamics etc.
There are many use cases, you can customize it and let us know through comments. to get featured here.
How to use it
The application is packaged as a WAR file and can be downloaded from the following link
Download the WAR file directly
you can optionally clone the entire project from Git hub.
git clone https://github.com/AKSarav/CPU_MEM_MonsterApp
Once you have downloaded the war file.
Deploy the WAR file into your application server (weblogic, JBoss, tomcat) and start the application
In my case it is Tomcat
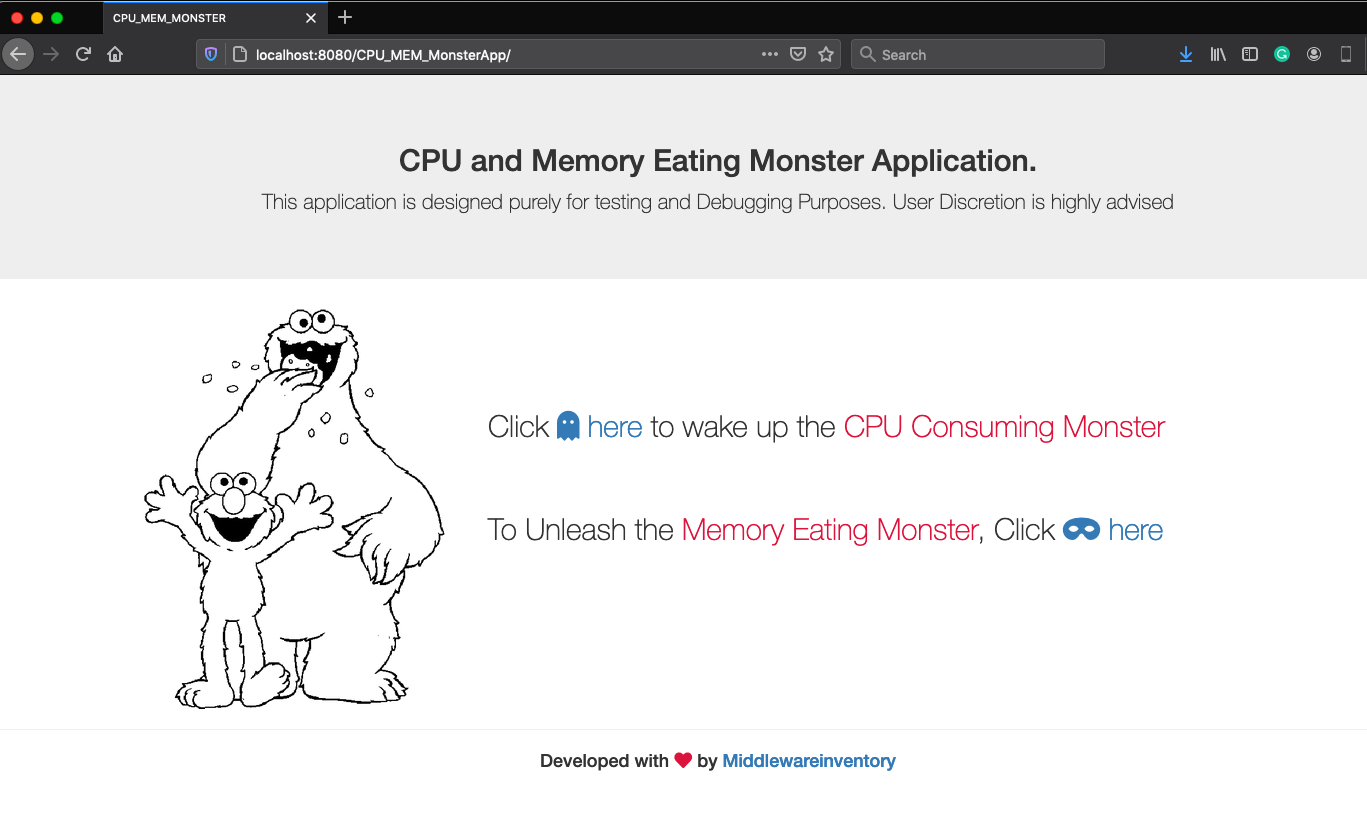
Access the application in your browser ( preferably modern browsers for better UI ) you will get the application front screen shown earlier
Upon selecting either the CPU and Memory Monster ( I named it for fun ) you will see the config/initialization page.
Before Starting the CPU/MEM monster - Enable JMX Monitor
To make sure that the application is working and to see it impacting the server. You should be ready with some JMX monitor (or) some CLI tools like top or our Java Thread Top tool
JMX monitor can show you some graphs to compare, before and after
To know how to enable JMX monitor in Tomcat or weblogic refer the following articles
I hope you are ready with the JMX monitoring enabled and JConsole/VisualVM connected to your application server instance.
In my case, I am using jconsole to connect to my local tomcat where the monster app is deployed.
This screenshot is taken before starting the application.
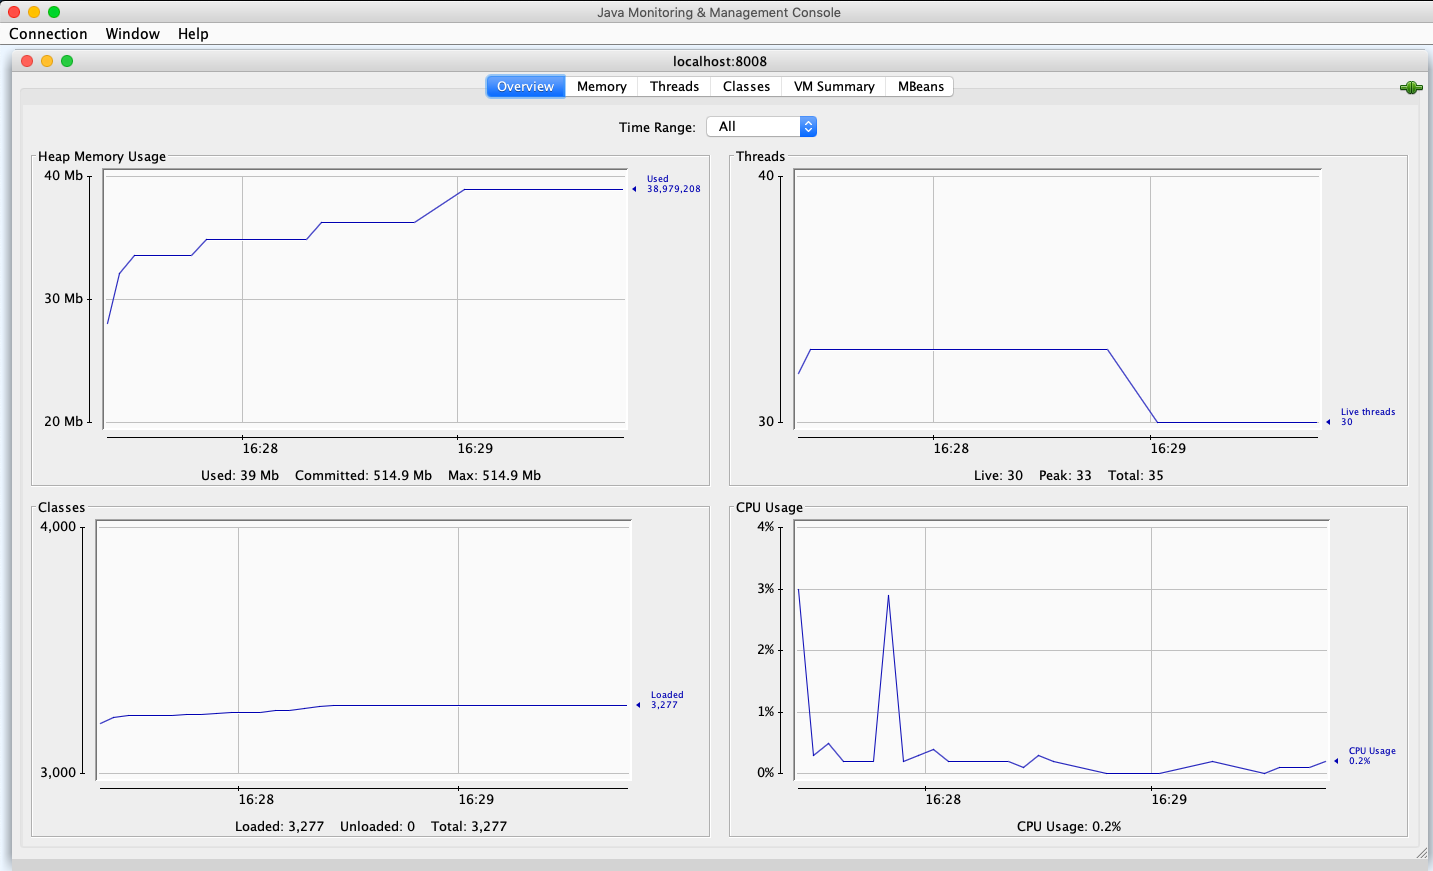
Check Maximum Heap Size allocated to your JVM (Xmx)
I have given 512MB of Maximum heap memory to my tomcat instance using JVM Xmx flag.
To know how to increase Heap Size on tomcat refer to this article
Now all set!. let us invoke/wake up the monster
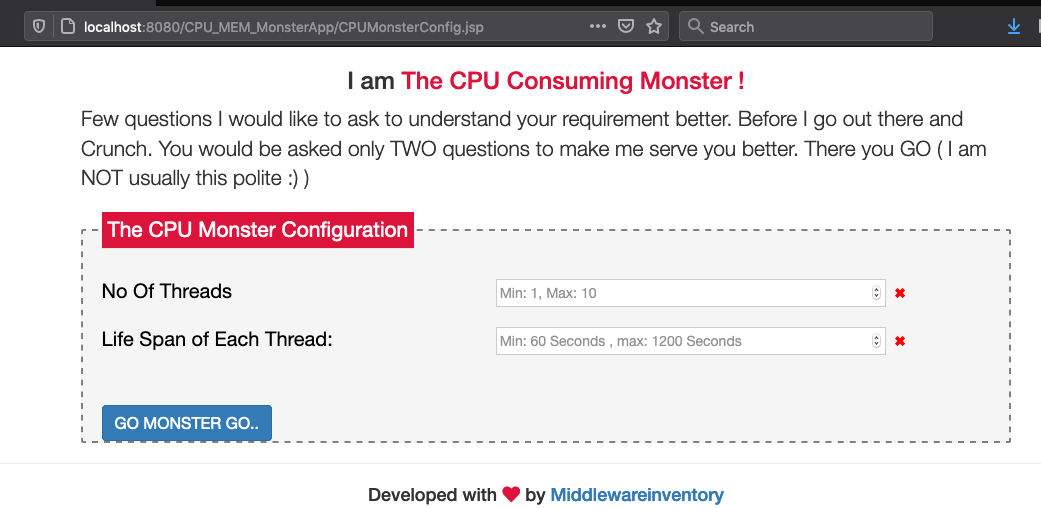
Invoking the CPU Consuming Monster and Validating
You will see a configuration page like this and you have to enter the Number of Threads and the Life Span of each thread
These threads would be created when you click on Go Monster Go and you would be able to see the CPU usage of your JVM increased drastically.
Once you have submitted the values, you would get some page with a message that the monster is invoked.
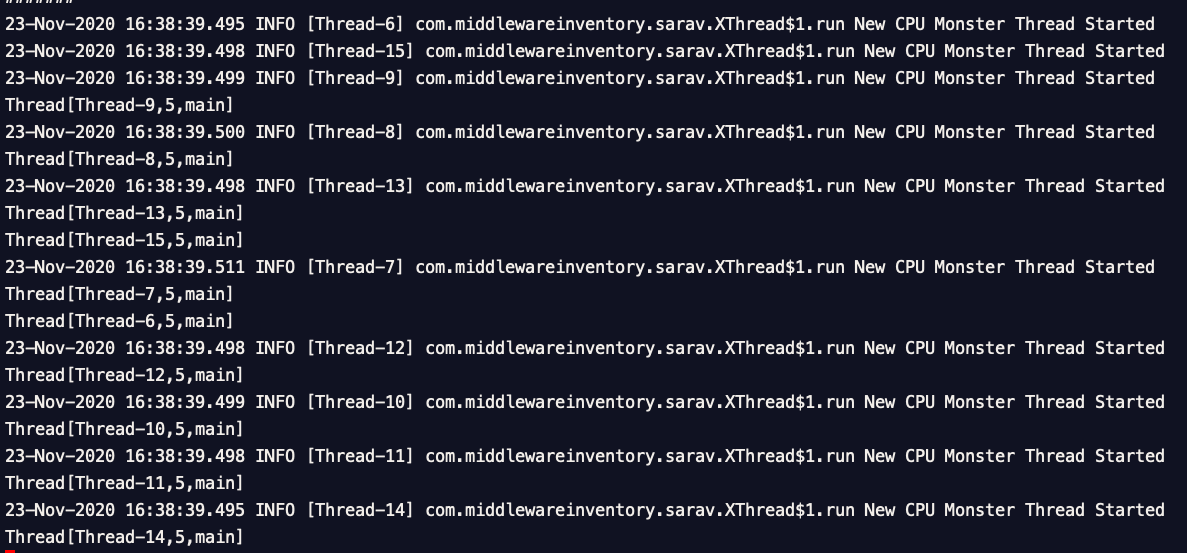
Also, you can see some logs in the JVM Systemout log file, in case of tomcat it is catalina.out file
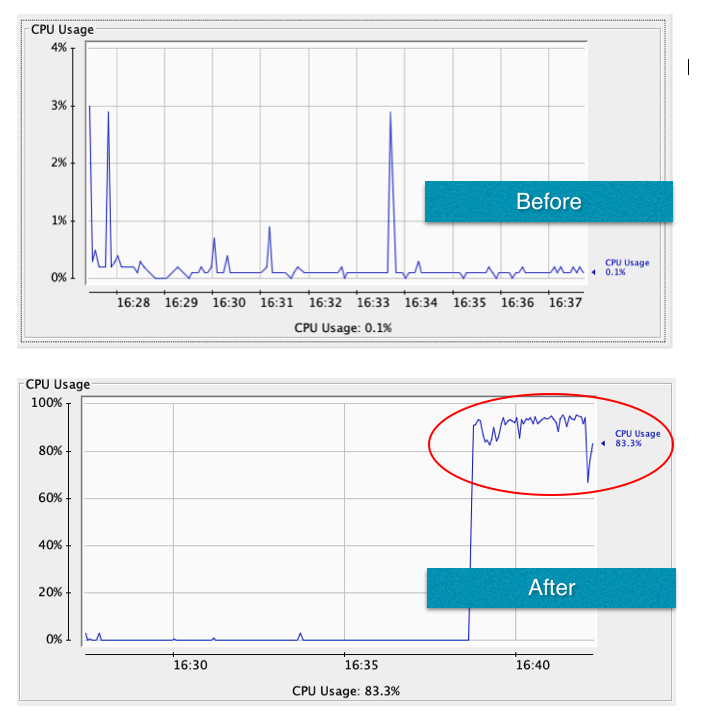
You can visibly notice a spike in CPU usage in JMX monitor.
If you look at the application server out log you can see some messages printed like this
Invoking the Memory Consuming Monster and Validate it
Now on the Initialization page click on the Invoke Memory eating monster and launch the configuration page to define few things for the Memory monster to begin
You would see some page like this
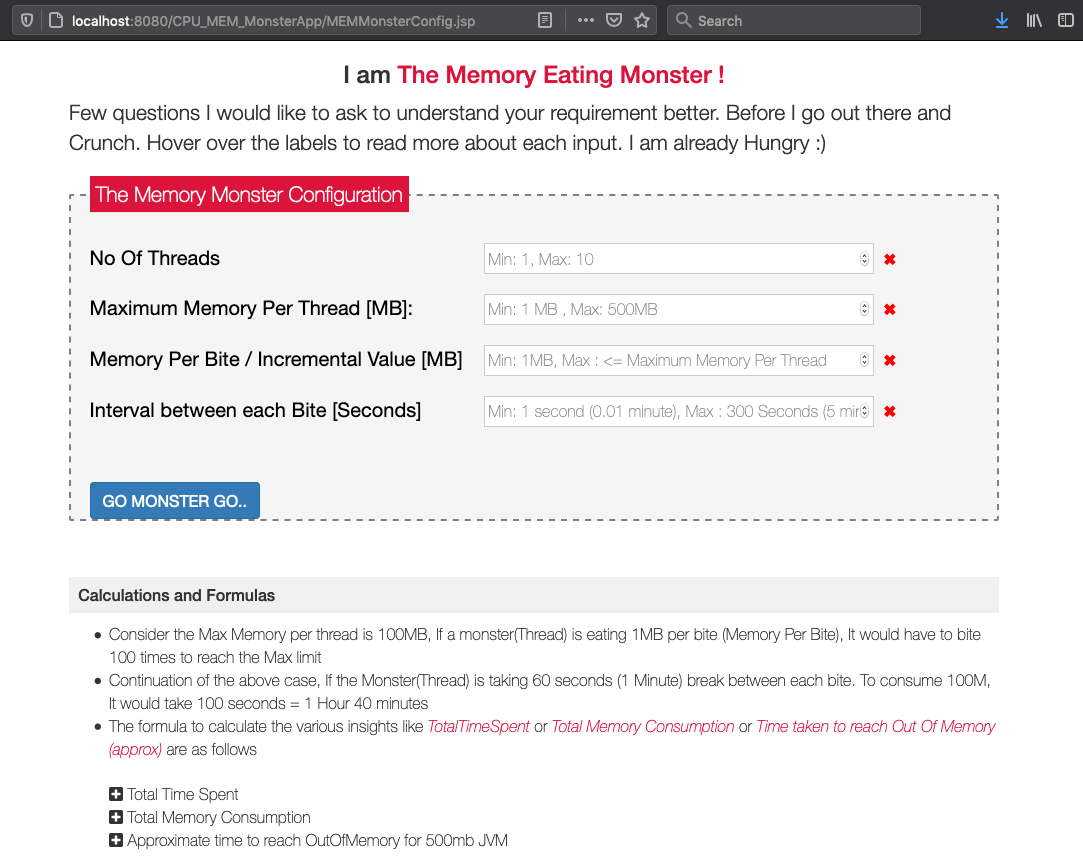
All the necessary information required to use this page are already provided on the same page.
However, Here is the short explanation to each input
No of Threads - to define how many threads to be created by this monster. I have limited the number of threads value to be 1 to 10 as it is enough with the right memory configuration to starve the JVM for memory (or) create OutOfMemory
Maximum Memory Per thread - A Maximum memory a single thread can consume in its lifetime. limited between 1 to 500MB
Incremental Value / Memory per bite - How much memory a thread can eat/consume per cycle. Though you have given 500MB for the Maximum Memory per thread and give 5MB for this incremental value. a thread would eat 5MB per bite/cycle and take 100 times to consume the whole 500MB.
interval between each cycle/bite - Basically a sleeping time for the thread between each cycle/bite. If you want it to be quicker you can reduce the interval between each cycle/bite. Or if you want the thread to be steadily consuming the memory. you can give more value for this
There are few simple calculations on the same screen explaining how long does it take to consume 500MB of JVM.
The Page is designed as self-explanatory, if you still have questions let me know in comments I will help.
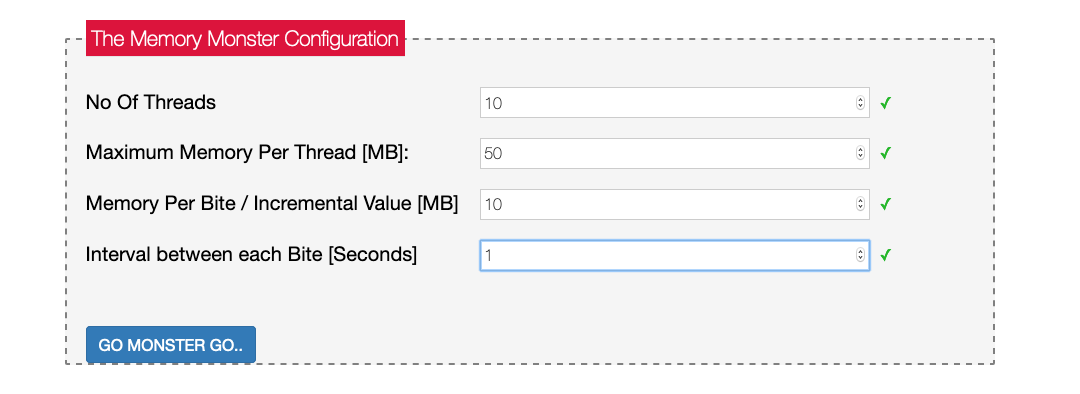
Now time to validate the graphs.
These are my configuration values for a 512MB of JVM
Graphs from JConsole
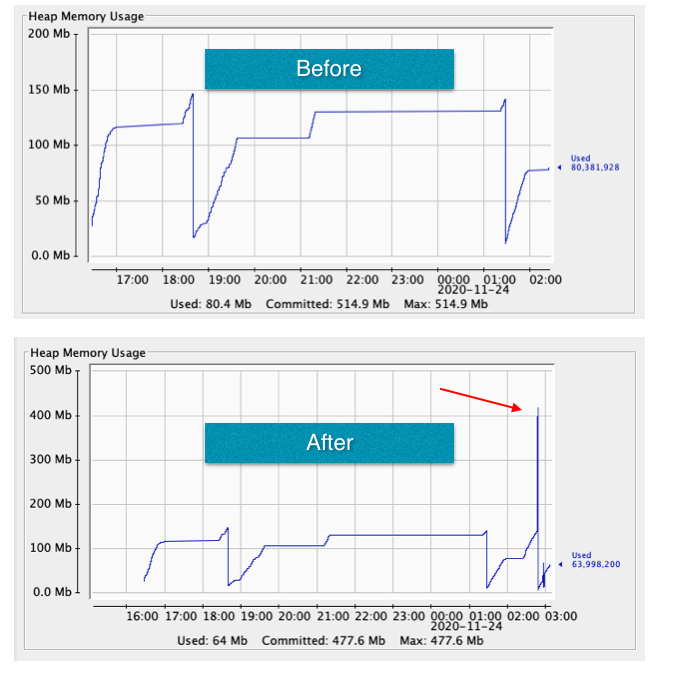
In the preceding screenshot, you can see a Spike and the memory has scaled up to 477MB before Garbage collection kicks in and Out Of memory error appear on the log
24-Nov-2020 02:47:42.069 INFO [Thread-20] com.middlewareinventory.sarav.MemMonster.MemMonsterThread Allocating 10000000 To the Vector
24-Nov-2020 02:47:42.144 INFO [Thread-20] com.middlewareinventory.sarav.MemMonster.MemMonsterThread After Allocation free memory: 60241008
Current VectorSize:41
24-Nov-2020 02:47:42.238 INFO [Thread-20] com.middlewareinventory.sarav.MemMonster.MemMonsterThread Taking a Chewing Break for 1000 Milliseconds
24-Nov-2020 02:47:43.268 INFO [Thread-20] com.middlewareinventory.sarav.MemMonster.MemMonsterThread Allocating 10000000 To the Vector
Exception in thread "Thread-20" java.lang.OutOfMemoryError: Java heap space
Conclusion and a Disclaimer
This application is designed purely for debugging and testing purposes and you are advised to use this with caution and proper approvals.
Hope this helps
Cheers
Sarav AK

Follow me on Linkedin My Profile Follow DevopsJunction onFacebook orTwitter For more practical videos and tutorials. Subscribe to our channel
Signup for Exclusive "Subscriber-only" Content