Creating Application is Tough, I agree. So does monitoring the application statistics like Number of Hits, Response time etc. But if we have the right tools in hand, we can do wonders
In this post, we are going to develop a Simple NODE JS web application with StatsD and Graphite to Monitor the Number of Hits and the throughput etc.
Nowadays Every monitoring and Statistics has become a Chart and Graphs and we are going to build one ourselves using StatsD and Graphite.
Prerequisites
In this post, All the Components like NODEJs, StatsD and Graphite are going to be launched as Containers on Docker technology. It is Quick and Easy. If you are entirely new to Docker, that's fine too.
Just Install Docker CE and continue from here.
If you want to learn basics about Container and Docker, Refer to these post
Before moving in, So what is StasD?
A network daemon that runs on the Node.js platform and listens for statistics, like counters and timers, sent over UDP or TCP and sends aggregates to one or more pluggable backend services (e.g., Graphite).
Since it is being a network Deamon, It can receive data over the network as UDP/TCP packets. A Quick and easy way to send the metric to the StatsD is with nc (netcat) command
The Following command will increment the pointer named foo.
This would all make sense when we see it in practice. So Continue to read.
echo "foo:1|c" | nc -u -w0 127.0.0.1 8125You can find more information about StatsD in here
StatsD can Support a variety of metrics like Counter, Sets, Gauges and you can read more about all of them here
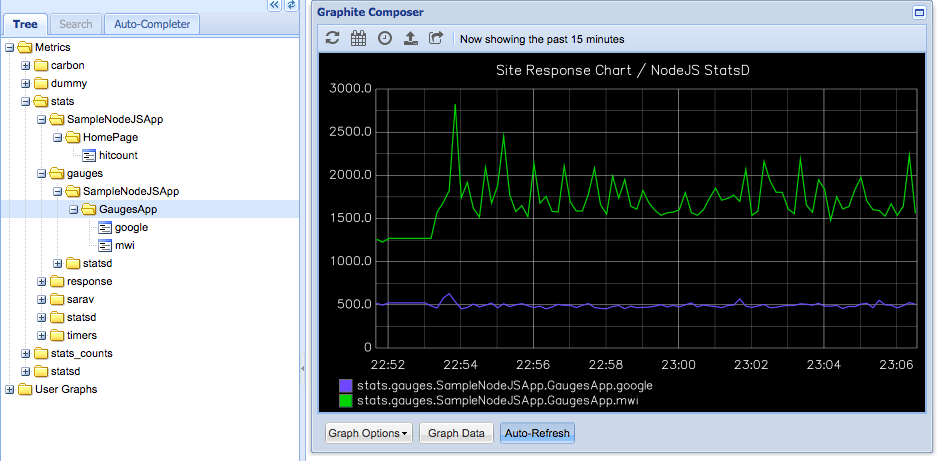
A Quick Glimpse to our End Product, So that you don't get bored
This is how our End Result would look like. Is it not it Cool?. Trust me!. We are going to build this Step by Step from Scratch.
Index
- Steps for Docker + NodeJS + StatsD + Graphite Configuration
- Run the Graphite, StatsD image as a Container using Docker CLI
- Make Sure the Container is Running and Graphite UI is ACTIVE
- Create the NODEJS Image with Lynx and Express
- Launch the NodeJS Application Image as a Container
- Validate the Graphite and NodeJS Containers are running
- Create a Network in Docker and map these two containers
- A Quick Validation of the Application
- A Load Testing and Graph Generation
- Conclusion
Steps for Docker + NodeJS + StatsD + Graphite Configuration
As we already mentioned, all our key elements are going to be Docker Containers. We presume that you have the basic knowledge on Docker and have it installed in your Machine.
Now in your host where you have Docker CE and CLI installed, Execute the following steps,
Step1: Run the Graphite, StatsD image as a Container using Docker CLI
Here the Image name is graphiteapp/graphite-statsd and it would automatically be downloaded from hub.docker.com if not present locally.
docker run -d\
 – name graphite\
 – restart=always\
 -p 80:80\
 -p 2003-2004:2003-2004\
 -p 2023-2024:2023-2024\
 -p 8125:8125/udp\
 -p 8126:8126\
 graphiteapp/graphite-statsd
Here
--name: Is to Name the Container. We named this container as graphite
--restart: this is to say Docker to Restart the container in case of a Box reboot or failure
-p: Port forwarding, Left to the colon is the Host port and Right to the colon is the Container Port
That's All. Your Graphite, StatsD installation is Ready.
This is what I was talking about earlier, Just think, with no Container technology in hand it would have taken a lot of time for us to create an Infrastructure with Graphite and StatsD installed and configured.
A Quick Note:
We named this container as graphite which will later be referred in the NodeJS Application as a host name of StatsD server.
Refer Step3b, Index.js file
var metrics = new lynx('graphite', 8125, opt);
You can find a line like this, Where the graphite stands for the hostname of container/server where the statsD is running. In our case it is a container.
So Make Sure you follow this convention or change in both the places.
Step2: Make Sure the Container is Running and Graphite UI is ACTIVE
Now we need to make sure the Container is running and Graphite is working
Execute the Following Docker CLI command to make sure that your container is running
$ docker container list
CONTAINER ID        IMAGE                         COMMAND             CREATED             STATUS              PORTS                                                                                                                                                                       NAMES
0dcc76ab681d        graphiteapp/graphite-statsd   "/entrypoint"       2 days ago          Up 4 hours          0.0.0.0:80->80/tcp, 0.0.0.0:2003-2004->2003-2004/tcp, 2013-2014/tcp, 8080/tcp, 0.0.0.0:2023-2024->2023-2024/tcp, 0.0.0.0:8126->8126/tcp, 8125/tcp, 0.0.0.0:8125->8125/udp   graphite
Also, make sure the Graphite Web Interface is accessible at http://localhost/
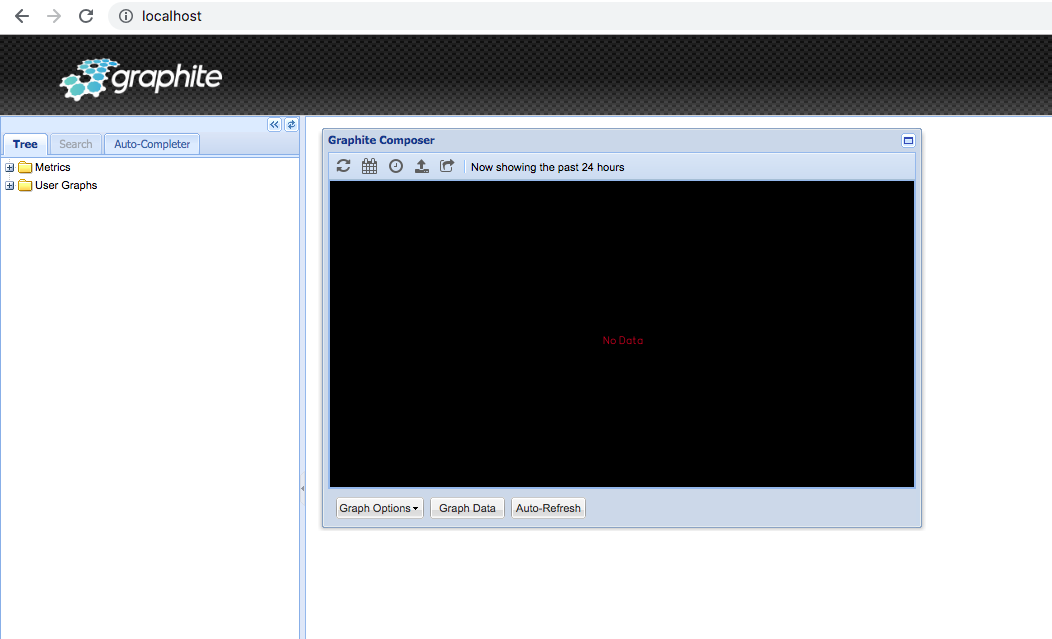
Step3: Create the NODEJS Image with Lynx and Express
Express is a widely used Node JS web Application framework and Lynx is a client package
We are going to use them together in our application for serving a page and to connect to StatsD. We are also going to use a Package named request to connect to remote URLs.
The Application is designed to connect to two remote URLs and collect some data and we are going to calculate the time it spends on two different websites.
One is www.google.com and the other one is www.middlewareinventory.com
Step 3A: Create a Work Space
You can choose any existing directory of your choice or create a new one. I am creating a new directory for this example. We are going to perform all the upcoming tasks.
mkdir /apps/docker/NodeStatsD
Step 3B: Create Index.js file with the following content.
I tried to cover the most used metrics like Gauges, Timer, Sets, Counter etc and placed each of them under a Single URI or Listener.
const express = require("express");
const lynx = require("lynx");
const request = require("request");
const app = express();
var opt = {};
opt.prefix = 'SampleNodeJSApp';
var metrics = new lynx('graphite', 8125, opt); // StatsD IP & Port

//Example1 - Hit Count Home Page
app.get("/", (req, res) => {
    res.send("Welcome to HomePage");
    metrics.increment('HomePage.hitcount');
});

//Example2 - Gauges App
app.get("/GaugesApp", (req, res) => {
    res.send("Welcome to GaugesApp Page");
    request.get({
        url : 'https://www.middlewareinventory.com',
        time : true
      },function(err, response){
        console.log('MWI Request time in ms', response.elapsedTime);
        metrics.gauge('GaugesApp.mwi', response.elapsedTime);
      });
      request.get({
        url : 'https://www.google.com',
        time : true
      },function(err, response1){
        console.log('Google Request time in ms', response1.elapsedTime);
        metrics.gauge('GaugesApp.google', response1.elapsedTime);
      });


});


//Example3 - Timer App
app.get("/TimerApp", (req, res) => {
    res.send("Welcome to TimerApp Page");
    request.get({
        url : 'https://www.middlewareinventory.com',
        time : true
      },function(err, response){
        console.log('Request time in ms', response.elapsedTime);
        metrics.timing('TimerApp.mwi', response.elapsedTime);
      });

      request.get({
        url : 'https://www.google.com',
        time : true
      },function(err, response1){
        console.log('Request time in ms', response1.elapsedTime);
        metrics.timing('TimerApp.google', response1.elapsedTime);
      });


});


 //Example4 - User Defined Sets
 app.get("/Sets", (req, res) => {
    metrics.set('Sets.user', 'Sarav');
    metrics.set('Sets.user', 'Sarav');
    if (Math.random() > 0.9)
    {
        metrics.set('Sets.user', 'Jarvis');
    }
    setTimeout(pick, 1000);
});


app.listen('8080', () => {
    console.log("Started Listening in Port 8080");
});
Just a Reminder:
Hope you read our caveat on Step1 about the Container Name being graphite and the line of code in index.js representing the statsd server.
var metrics = new lynx('graphite', 8125, opt);
Our NodeJS Application looks for a statsd server with the hostname graphite, In our case it is a container.
Step 3C: Create package.json file with the following content.
{
    "dependencies": {
        "express": "*",
        "lynx": "*"
        "request": "*"
    },
    "scripts": {
        "start": "node index.js"
    }
}
we have two dependencies for this node application.
- express - An Application framework
- lynx - A Client Package to Connect to StatD
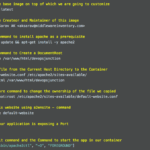
Step 3D: Create Dockerfile with the following content.
Refer to the comments before each line to understand what it is meant to do.
# Base Image
FROM node:alpine

# Working Directory
WORKDIR "/app"


# COPY the package.json file
COPY package.json .

# RUN command to install programs
RUN npm install

# COPY All the files from Host Present Working Directory to Container
COPY . .

# Start the program
CMD ["npm", "start"]
Make Sure your Directory is having these aforementioned three files. Before you proceed, Just validate if your present workspace is looking similar to what is shown below
aksarav@middlewareinventory:/apps/docker/NodeStatsD $ tree /apps/docker/NodeStatsD
/apps/docker/NodeStatsD
├── Dockerfile
├── index.js
└── package.json
Step 3E: Build the Image
In the workspace directory itself. Execute the following command to build the image, It might take a minute or two during the first time so please wait.
docker build -t nodestatsd .
We are naming this image as nodestatsd
You can make sure that image is created and available in the local Docker Image Repository using the following Docker CLI command.
docker image ls nodestatsd
As we are done with the NodeJS Application Image and it is ready to be launched as a container with StatsD Lynx module.
Step4: Launch the NodeJS Application Image as a Container
There cannot be any perfect time than this to start the docker image we have created in the previous step (step3) . So Go on and Create a Docker Container from the image.
Use the following command
docker container run -p 8080:8080 -it -d – name nodejs-statsd nodestatsd
Here the Image Name is nodestatsd and the Container Name is nodejs-statsd
Step5: Validate the Graphite and NodeJS Containers are running
Using the Docker CLI commands, We need to make sure that the Containers we have started on Step1(Graphite) and Step4 (NodeJS App) are up and running.
aksarav@middlewareinventory:/apps/docker/NodeStatsD $ docker ps
CONTAINER ID        IMAGE                         COMMAND             CREATED             STATUS              PORTS                                                                                                                                                                       NAMES
abe175dc62a9        saravak/nodestatsd            "npm start"         6 seconds ago       Up 5 seconds        0.0.0.0:8080->8080/tcp                                                                                                                                                      nodejs-statsd
44913556eedd        graphiteapp/graphite-statsd   "/entrypoint"       9 minutes ago       Up 9 minutes        0.0.0.0:80->80/tcp, 0.0.0.0:2003-2004->2003-2004/tcp, 2013-2014/tcp, 8080/tcp, 0.0.0.0:2023-2024->2023-2024/tcp, 0.0.0.0:8126->8126/tcp, 8125/tcp, 0.0.0.0:8125->8125/udp   graphite
As we have successfully validated that both the containers are running. Now we need to connect them with each other.
There are multiple ways to connect two different containers in docker such as
- Docker Compose
- Docker Container Link
- Docker Shared Network.
My favourite is the 3rd one and it also recommended by Docker.
Step6: Create a Network in Docker and map these two containers
Using Docker CLI commands we need to create a network (bridged) and map these two containers to that network so that they can communicate with each other.
In other words, NodeJS Application would be able to communicate to the Graphite StatsD Container just by referring its name.
Hope you remember we spoke about this in Step1. Our StatsD Container Name is Graphite and it has hardcoded into the NodeJS Application code.
Step6a: Create a Network
$ docker network create nodeapp-statsd-Net
473360475ebebd266460aa170f1e788376d384e439ca8dc3417f65aac06ff808
We Named our new network as nodeapp-statsd-Net
You can validate the Successful creation of this network and its type using docker network ls command
The Default Driver type of the Docker Network is Bridge and that is sufficient for us
Step6b: Connect our Running Containers to this network
The Syntax of the Docker Network Connect command is as follows.
$ docker network connect [NETWORK NAME] [CONTAINER NAME]
When you replace the placeholders with the actual network name and Container name of ours. We will get some command like below.
Execute these commands one after another [ No Response message would come that's OK ]
$ docker network connect nodeapp-statsd-Net graphite
$ docker network connect nodeapp-statsd-Net nodejs-statsd
Step6c: Inspect the connected containers to the Docker Network
Using the following Docker CLI command you can actually list a Specific docker network and see what are the containers connected to that network.
$ docker network inspect nodeapp-statsd-Net
[
    {
        "Name": "nodeapp-statsd-Net",
        "Id": "473360475ebebd266460aa170f1e788376d384e439ca8dc3417f65aac06ff808",
        "Created": "2019-05-20T21:37:29.0008195Z",
        "Scope": "local",
        "Driver": "bridge",
        "EnableIPv6": false,
        "IPAM": {
            "Driver": "default",
            "Options": {},
            "Config": [
                {
                    "Subnet": "172.22.0.0/16",
                    "Gateway": "172.22.0.1"
                }
            ]
        },
        "Internal": false,
        "Attachable": false,
        "Ingress": false,
        "ConfigFrom": {
            "Network": ""
        },
        "ConfigOnly": false,
        "Containers": {
            "44913556eedd31b71524bd1b66ef7f9400214400a5aa40bcb2394bb3212606b1": {
                "Name": "graphite",
                "EndpointID": "3c60d9c82d0cd19824576982b6b10f93e9c6476cdcf87034e5171558c5a57eab",
                "MacAddress": "02:42:ac:16:00:02",
                "IPv4Address": "172.22.0.2/16",
                "IPv6Address": ""
            },
            "abe175dc62a9295a138449dc94c31aa6822d6f08670def2adda3e83898c1f80d": {
                "Name": "nodejs-statsd",
                "EndpointID": "403c14ee076f7acdc055433b05f58d005891d8729c0ba3cdfc213364a5590f07",
                "MacAddress": "02:42:ac:16:00:03",
                "IPv4Address": "172.22.0.3/16",
                "IPv6Address": ""
            }
        },
        "Options": {},
        "Labels": {}
    }
]
From the Output of the preceding command, you can see that our containers named graphite and nodejs-statsd are connected to the network nodeapp-statsd-Net
Thereby, we have successfully established a Container to Container Connectivity between two containers. You can attach N number of containers to the same network and create a Connectivity/communication channel between them.
Step6d: Before Testing Do a STOP and START on these containers
Before starting our testing. I would recommend stopping and Starting our containers so that our containers are as fresh as possible.
# Stop the Containers
$ docker stop nodejs-statsd
$ docker start nodejs-statsd

# Start the Containers
$ docker stop graphite
$ docker start graphite
Time for the Rocket Launch aka Validation
T Minus 9 Seconds. 8,7,6,5,4,3,2,1
Now you can access the URLs we have designed in the index.js file on our Application /GaugesApp, /TimerApp etc.
In your host machine where you are running the containers ( in my case MAC) open a browser and try the URLs
http://localhost:8080/GaugesApp
http://localhost:8080/
http://localhost:8080/TimerApp
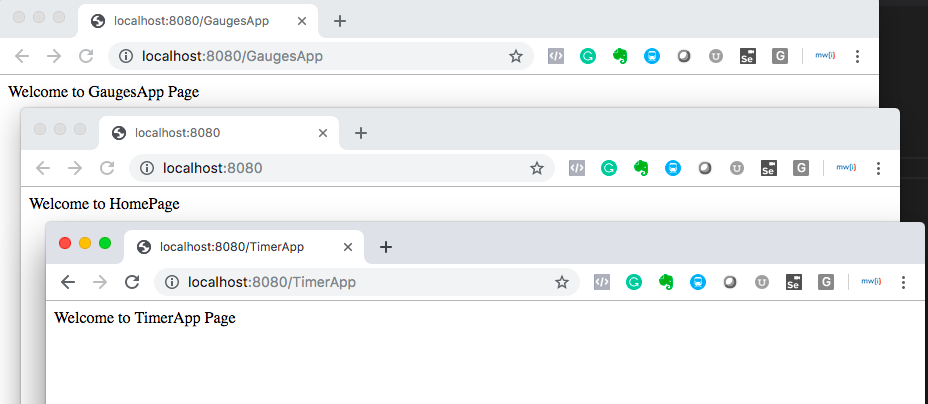
You should see the page displayed with a Single Line message containing the Application Name you have reached.
Though this calls can be tracked in StatsD - Graphite web interface. We need more data for the Graph to Generate and look good.
A Load Testing and Graph Generation
I have built a Simple Shell script that runs with 5 seconds interval and access the http://localhost:8080/GaugesApp and http://localhost:8080/ urls
#!/bin/bash

while true; do
  # To Try Home Page
  curl http://localhost:8080/

  # To Try Gauges App
  curl http://localhost:8080/GaugesApp
  echo ""
  sleep 5
done
When you run this script it gives a call to the HomePage and GaugesApp.
Since the GaugesApp is designed to connect to remote websites and do some task (just imagine that's our logic) we can actually monitor the time taken to complete this remote HTTP call and display it as a graph
To Access the GaugesApp Graph.
Go to Graphite Web Interface -> stats -> gauges -> SampleNodeJSApp -> GaugesApp
and To Access the HomePage Graph
Go to Graphite Web Interface -> stats -> gauges -> SampleNodeJSApp -> GaugesApp
Here is the final Graph showing the response times of Google and Middlewareinventory ( Suppose that's our Logic in the NodeJS Application)
Conclusion
In this long and brief post, we have designed our own NodeJS appliation with Express, Lynx and Request modules with a logic to connect to remote servers/urls and perform NO action. We have also created a Docker Image and started this NodeJS Application as a container named "nodejs-statsd" and started another container named graphite from the official Graphite-StatsD image
We created a Docker Network and Connected these containers together and enabled connectivity between each other.
Created a Shell Script to perform a quick load test by accessing the NodeJS Application which is designed already to add the counter and gauges to the graphite container.
Upon the Load Test running, We monitored the Graphite Web interface and observed the graphs of the response time of the remote URLs.
Note*: The Response-time monitoring can be done easily with proper plugins in hand with tools like Graphite and Grafana. This application is just a sample to give you an idea how NodeJS and StatsD works together and how to use StatsD for your Application monitoring.
Hope this article helps.
Rate this article [ratings] For any help feel free to comment.
Cheers,
Sarav

Follow me on Linkedin My Profile Follow DevopsJunction onFacebook orTwitter For more practical videos and tutorials. Subscribe to our channel
Signup for Exclusive "Subscriber-only" Content