In this article, we are going to see, How to collect tomcat logs with FluentD and send to Elastic Search.
FluentD Tomcat Elastic Search (EFK) setup would be covered in detail.
Technically this is known as EFK stack. an efficient and better alternative for the ELK stack
Elastic Search FluentD Kibana - Quick introduction

The only difference between EFK and ELK is the Log collector/aggregator product we use.
In EFK. The Log Collector product is FluentD and on the traditional ELK, it is Log stash.
For those who have worked with Log Stash and gone through those complicated grok patterns and filters. FluentD comes as a saviour.
FluentD is widely being adopted by the Micro Services and Container industry and it is no less for the Traditional VM based setup as well.
If you have a working setup of LogStash collecting logs from Tomcat. Read this article and give a chance to FluentD and you would not regret it.
With no further ado. let's jump into the objective.
Installing FluentD
In this task, we are going to see how to install the FluentD universal log collector in the Linux machine where Tomcat is running
You can download the fluentD agent from the following link
https://www.fluentd.org/download
In FluentD parlance, the Forwarder (or) Log Collector agent is called as a td-agent treasure data agent.
They also provide a lightweight version of Log Collector and Forwarder named as fluentd-bit which you can download from the same link.
For this article, we are going to take the centos/redhat and install the fully-powered td-agent
the following command would install the stable version (v3) of td-agent
curl -L https://toolbelt.treasuredata.com/sh/install-redhat-td-agent3.sh | sh
If everything goes well you would be able to see something like this and it ends with a message Installation Completed, Happy Logging
Resolving Dependencies
--> Running transaction check
---> Package td-agent.x86_64 0:3.8.1-0.el7 will be installed
--> Finished Dependency Resolution

Dependencies Resolved

===============================================================================================================================================================================================
Package Arch Version Repository Size
===============================================================================================================================================================================================
Installing:
td-agent x86_64 3.8.1-0.el7 treasuredata 52 M

Transaction Summary
===============================================================================================================================================================================================
Install 1 Package

Total download size: 52 M
Installed size: 156 M
Downloading packages:
td-agent-3.8.1-0.el7.x86_64.rpm | 52 MB 00:00:05
Running transaction check
Running transaction test
Transaction test succeeded
Running transaction
Installing : td-agent-3.8.1-0.el7.x86_64 1/1
adding \'td-agent\' group if needed...
adding \'td-agent\' user if needed...
Installing default conffile...
prelink detected. Installing /etc/prelink.conf.d/td-agent-ruby.conf ...
Installing logrotate.d config
Configure td-agent to start, when booting up the OS...
Verifying : td-agent-3.8.1-0.el7.x86_64 1/1

Installed:
td-agent.x86_64 0:3.8.1-0.el7

Complete!

Installation completed. Happy Logging!
Configuring FluentD
Upon completing the installation of td-agent you should be able to see the default configuration file created and present in the path /etc/td-agent/td-agent.conf
You can remove the already available content and paste the following content in that file.
We will go through this configuration file and its elements shortly.
      <source>
        @type tail
        time_key time
        format multiline
        format_firstline /^[0-9]+\-[A-Za-z]{3}\-[0-9]{4}\s[0-9]{2}\:[0-9]{2}\:[0-9]{2}.[0-9]+/
        format1 /^(?<time>[0-9]+\-[A-Za-z]{3}\-[0-9]{4}\s[0-9]{2}\:[0-9]{2}\:[0-9]{2}.[0-9]+)\s(?<LogLevel>[A-Z]+)\s(?<message>.+)$/
        path /opt/tomcat8/logs/catalina.out
        pos_file /tmp/myapp.log.pos
        tag dev.myapp.catalinalog
      </source>

      <filter dev.myapp.catalinalog>
        @type record_transformer
        <record>
        hostname ${hostname}
        </record>
      </filter>

      <match dev.myapp.catalinalog>
        @type elasticsearch
        host 172.99.1.218
        port 59200
        user datausr
        password password
        index_name fluentd.${tag}
        logstash_format true
        logstash_prefix dev.myapp.catalinalog
        flush_interval 1s
      </match>

      <source>
        @type tail
        path /opt/tomcat8/logs/localhost_access_log.%Y-%m-%d.txt
        pos_file /tmp/accesslog.pos
        tag dev.myapp.accesslogs
        format apache2
      </source>

      <filter dev.myapp.accesslogs>
        @type record_transformer
        <record>
        hostname ${hostname}
        </record>
      </filter>

      <match dev.myapp.accesslogs>
        @type elasticsearch
        host 172.99.1.218
        port 59200
        user datausr
        password password
    index_name fluentd.${tag}
        logstash_format true
        logstash_prefix dev.myapp.accesslogs
      </match>
There are three main elements in this configuration file
source - to Define input configuration
- set the type of our source here
tailis for monitoring the log file real-time there are various other source types like udp, tcp stream, unix socket, HTTP endpoint etc. read more about other types - define the source log file and its path using
pathdirective - specify the ruby regex pattern using
formatto filter the events/logs. Non-matching lines would be ignored - To enable multiline log collection with
format multiline - to define how to consider the new event in case of multiline logs using
format_firstline - tag the collected logs with the name using the
tagelement which would be later referred in the fluentD configuration file - set the pos (or) position file name using
pos_namewhich would be used by fluentD to keep track of the line numbers already processed and where to resume.
filter - to modify and update events
- the filter element is used to modify the event streams collected and tagged at the source segment.
- the filter name must match the tag name of the source. it would help in identifying the right source configuration.
- here we can add, remove, modify any field names and values before sending it to Elastic Search
- we are going to use
record transformerfilter plugin to add a new field namedhostnameand setting up the local hostname using the shell commandhostnameyou can useuname -nhere instead.
match - to send logs to Elastic Search
- With the
matchelement, we define what to do with the matching events collected and tagged at the source segment - the match name must be as same as the tag name we used in the source.
- here you can define where to send the matching events to the destination can be one of Elastic Search, Kafka, Mongo, S3, HTTP API, stdout and more
- We are using
ElasticSearchas our Destination output plugin and the credentials and connection details are specified in this segment- host: Elastic Search server hostname
- port: Elastic Search server port number
- user: Username to log in to Elastic Search/Kibana ( the user must have privileges to create an index and add new documents to index)
- password: Password to login to Elastic Search/Kibana
- index_name: the index name where the events should be stored in Elastic Search. In our case, it is our Tag
- logstash_format: to instruct fluentD to send the logs in Logstash format
- logstash_prefix: this would be the index name where the logs would be stored in Elastic Search/Kibana.
Permissions for FluentD to access the log files
As the td-agent process starts and runs with the user-id td-agent we should make sure this user is able to read our log files defined in the source element.
You can do it in multiple ways
- Setting 755 permission to the log files using umask
- Add the tomcat user into the
td-agentgroup - Change the ownership of the logs directory to td-agent user or group.
Starting FluentD ( td-agent)
As the installation of td-agent takes care of creating a service. you can simply start the fluentD agent (td-agent) using the following command
service start td-agent
You can execute a simple ps -eaf command to find if you td-agent is running successfully. the logs would be written into the /var/log/td-agent/td-agent.log file, in case you need it for debugging.
Configure and Validate Elastic Search
Now the FluentD is ready to send the logs to Elastic Search. But there are few steps we must perform in Elastic Search before we are able to accept the logs coming in.
You must have privileges for creating index patterns and probably be an Admin in Kibana in order to perform these steps.
The Steps are as follows.
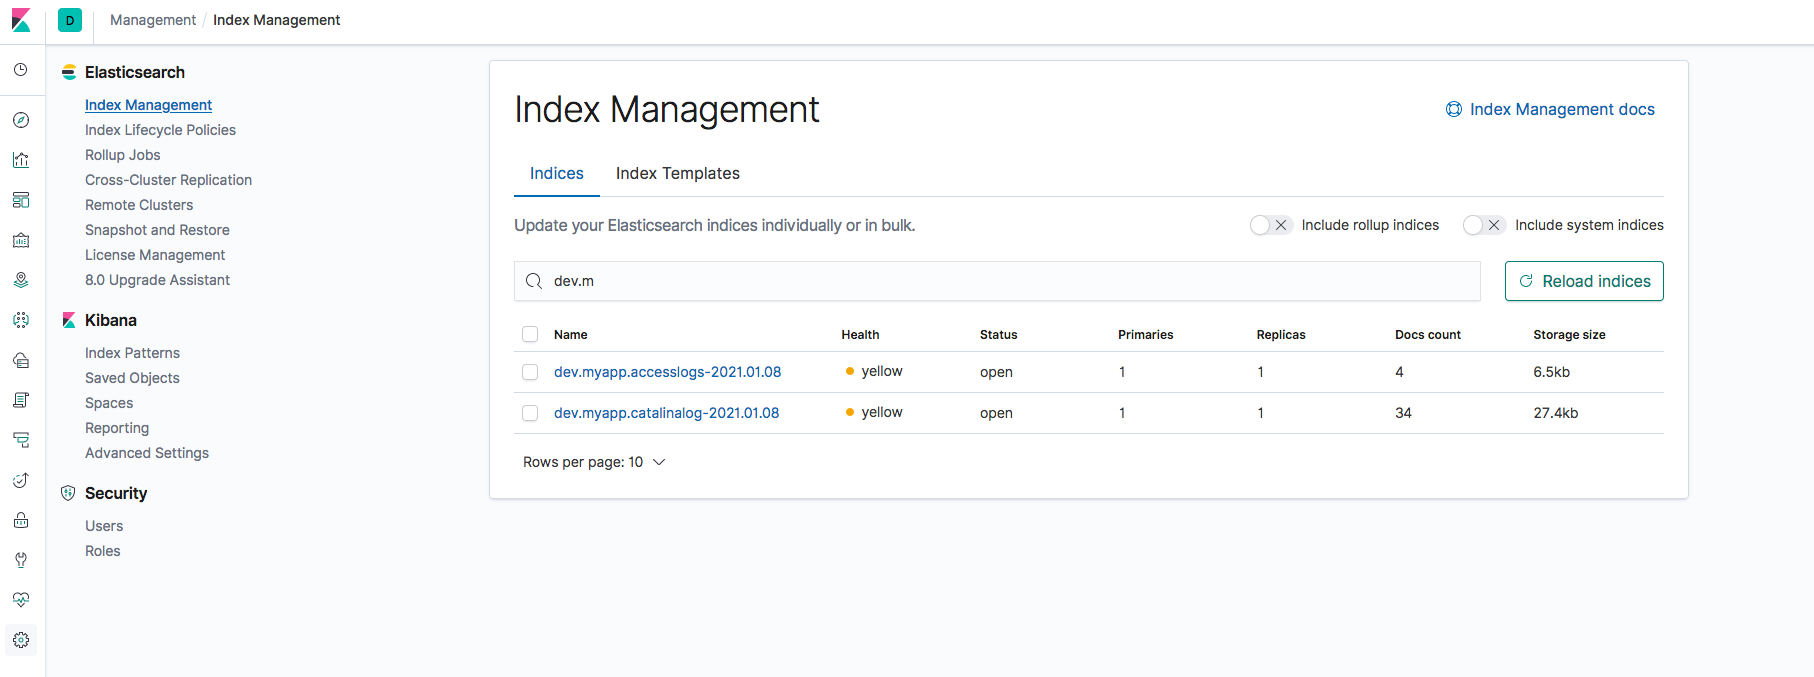
Validate the Index or Reload
In Kibana, Goto the Management/Settings and click on Index Management
Look for the index name we have defined in the FluentD configuration file. Since we have set up two log streams with two different indexes. You should be able to see both of them
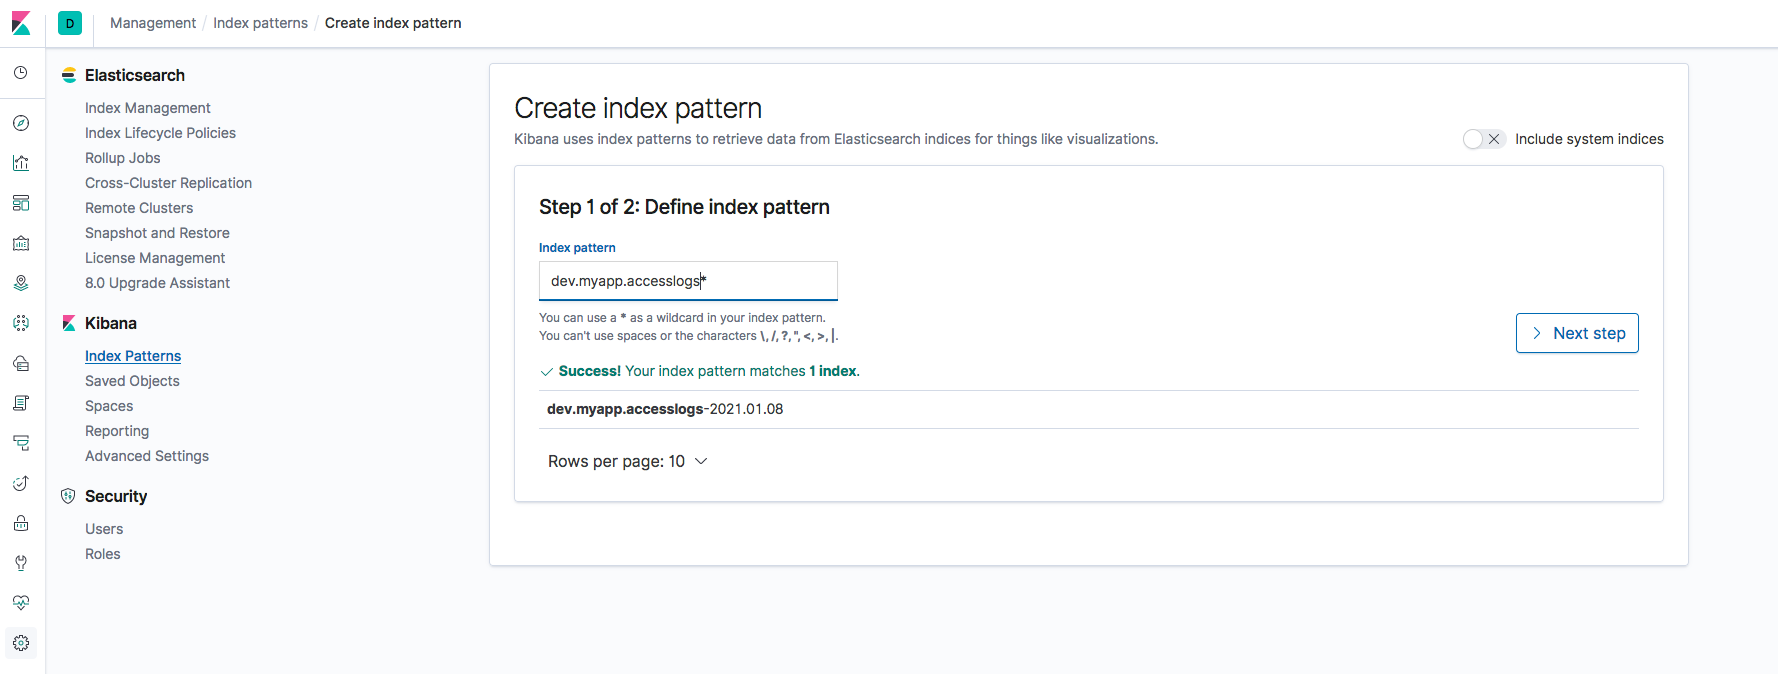
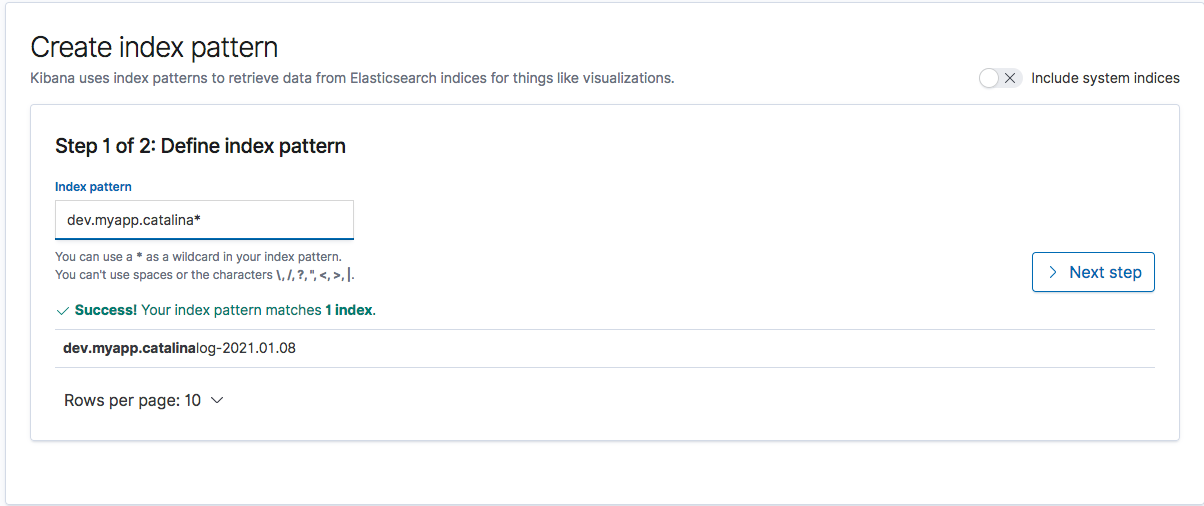
Creating Index Pattern
Since the indexes would have dates along with it. It is always recommended to create an Index Pattern which can be used for viewing the logs in Kibana Dashboard.
Here we are creating an index pattern dev.myapp.catalina* which would cover all the future indexes being created with this prefix.
Sames goes for the other index pattern dev.myapp.accesslogs* too
Refer the following screenshots for reference.
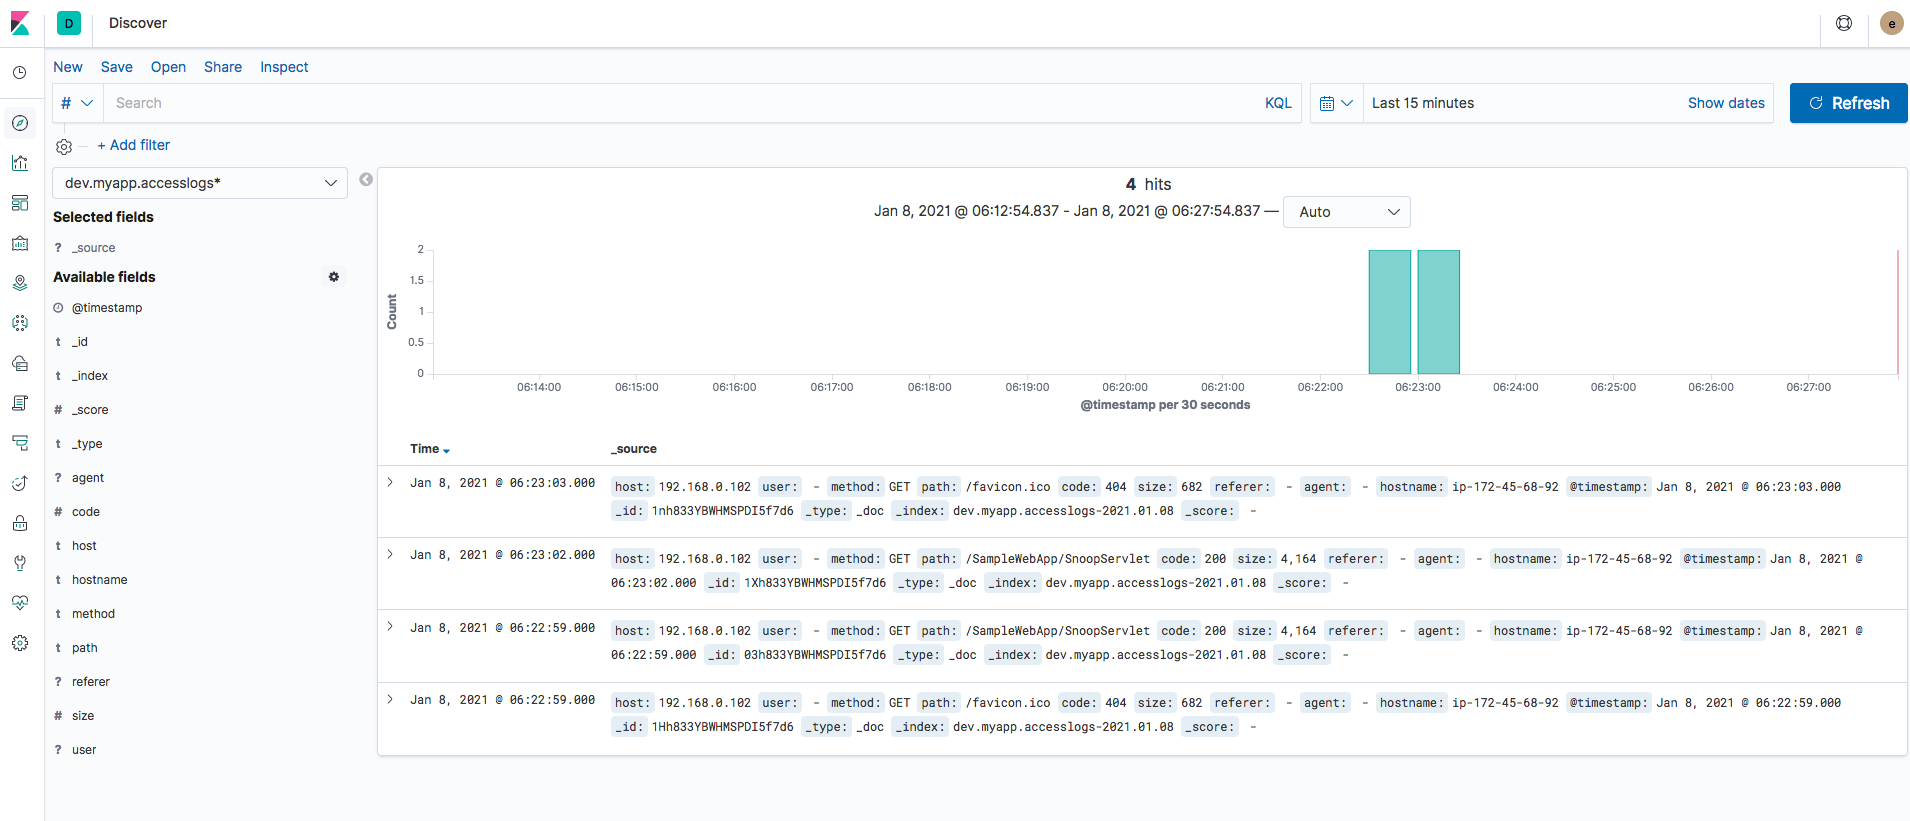
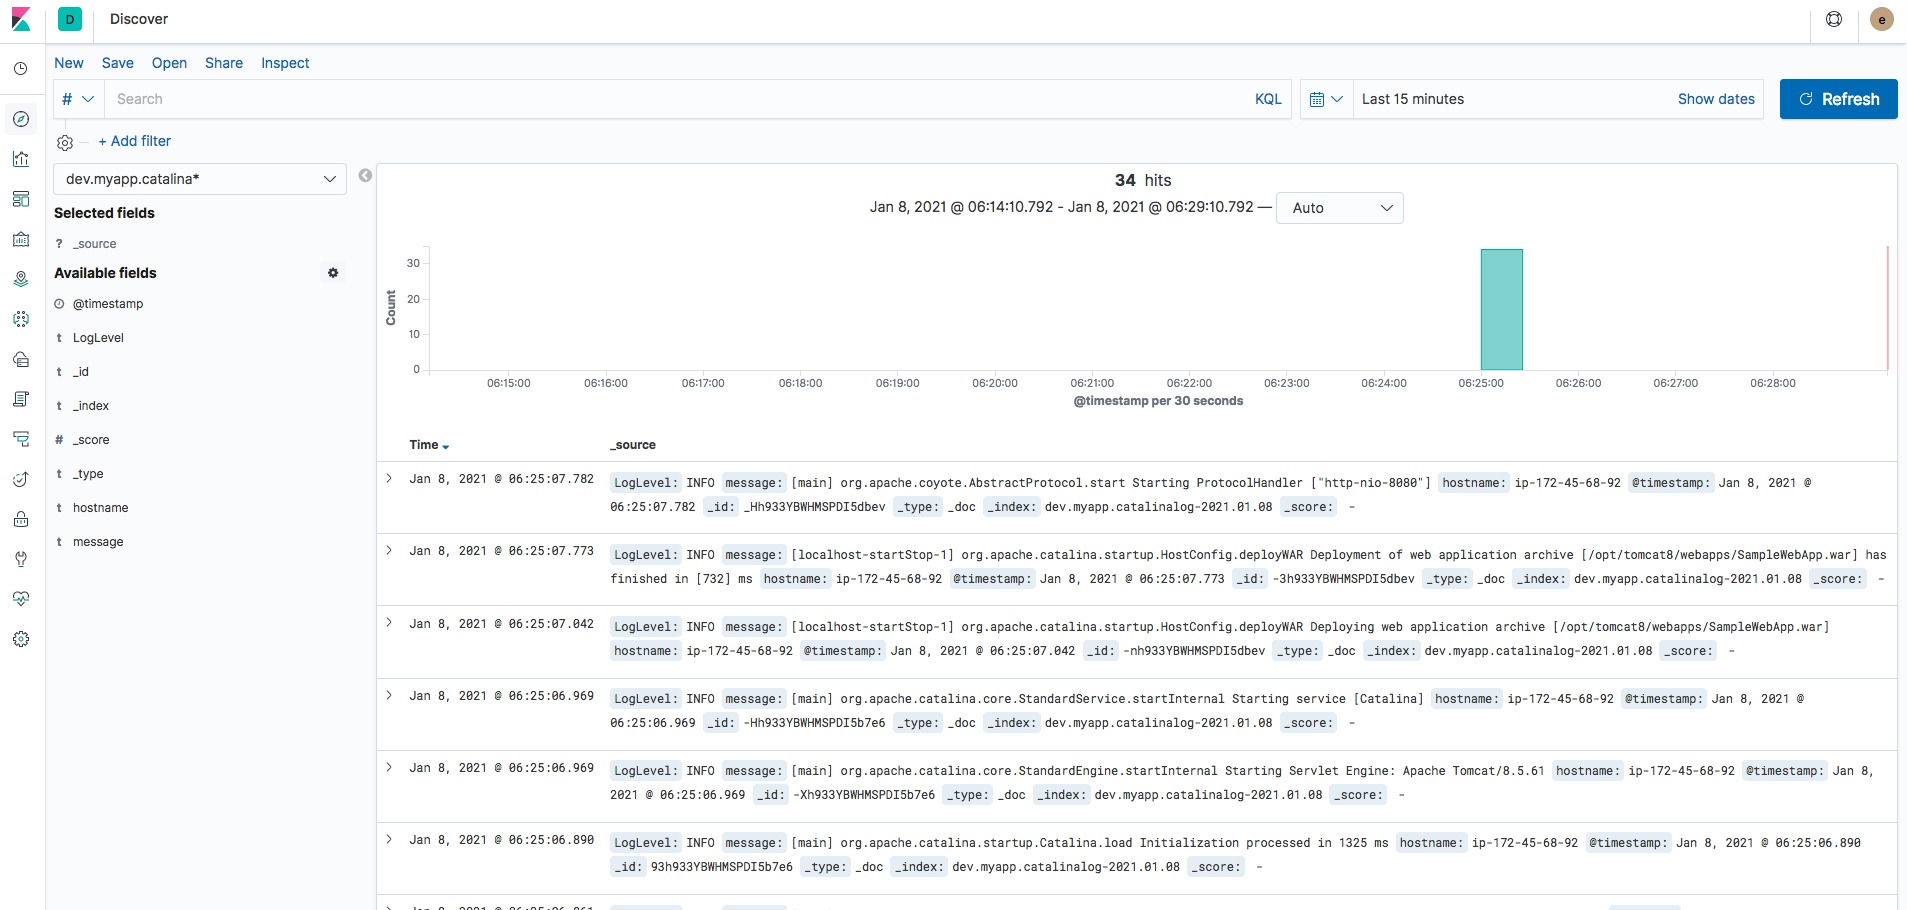
Validating the Logs in Kibana Dashboard
When you go to the Discover of Kibana and select the Index Pattern we have created and set the timeframe.
You can see the logs available and come in as soon as there is an entry in the corresponding log files on the server
Conclusion
In this post we have covered how to install and fluentD and setup EFK - Elastic FluentD Kibana stack with example. We have also covered how to configure fluentD td-agent to forward the logs to the remote Elastic Search server.
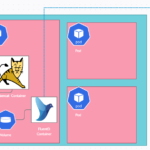
If you are looking for a Container-based Elastic Search FluentD Tomcat setup. ( EFK) on Kubernetes. Refer to my previous article.