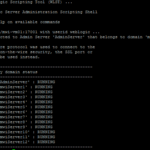
In this post, we are going to share the Weblogic Stuck Thread Monitoring Script which will automatically trigger an email notification and create heap and thread dumps when the maximum Thread stuck count has reached the threshold ( currently set to 10 but can be modified.)
This is written with WLST and Shell Scripts and it is property file based script and for security purposes, it has been designed to use the Weblogic Config file and Weblogic Keyfile for WLST authentication.
If you are not aware how to create these WebLogic Security and Configuration file you can read this post and come back here
This script has been tested in weblogic 11g and 12c .
Let us not get stuck here like this Bear. 🙂 Let's move on.

Salient Features of this Script
- Triggering Email Alert when the stuck thread count reached the threshold
- Creates Heap Dump and Thread Dump in case of Stuck Thread Identified and the threshold reached.
- Eliminate Duplicate Heap Dump and Thread dump Creation by monitoring the Count Growth
- Use Jstack and Jmap Utilities for more advanced results.
- Securely logging into Domain with Configfile and Keyfile, NO CLEAR TEXT PASSWORD
- Monitor all the Running Managed Servers in the Domain. Even if you are adding any new managed server in the future there is no need to update/modify the script.
- Works Perfectly with Weblogic 11g and 12c
How to use this script to Monitor Stuck thread
This script can be invoked on demand basis or can be scheduled in CRONTAB to run every 5 minutes or 10 minutes based upon your requirement and server capacity.
Here is the line you have to add in crontab after downloading the placing the scripts in place.
*/5 * * * * /path/to/workspace/weblogic_monitor_stuck.sh > /path/to/workspace/wlsstuckmonitor.log 2>&
Downloading the Scripts and Getting Ready.
At first, we need to decide where we are going to place these files. It should the workspace where all three files should be present.
Create a Directory or Choose the existing directory and copy all the following files with their respective names. Ideally, all three files must be present in the same directory.
Names must not be changed as it has internal references in other scripts
The Input Properties file
Save the file in the name input.properties in the same directory where you are placing the other two files
The Script creates few temp files in the /tmp directory and you can control their names by modifying the output.file variables.
domain.name=TestDomain
admin.url=t3://mytestwls.com:7101
config.file=/home/oracle/script/adminConfig.secure
key.file=/home/oracle/script/adminKey.secure
output.file1=/tmp/applist
output.file2=/tmp/datasourcelist
output.file3=/tmp/Serverstats
emailID[email protected]
DOMAINDIR=/opt/app/domains/TestDomain
The Python WLST Script
Save the file in the name wls_monitor_stuck.py in the same directory where you are placing the other two files
def usage():
  print "Usage:"
  print "java weblogic.WLST /home/oracle/script/wls_monitor_stuck.py"

def conn(URL,Configfile,Keyfile):
        try:
           connect(userConfigFile=Configfile, userKeyFile=Keyfile, url=URL)
        except:
           print 'UNABLE TO CONNECT To ADMIN SERVER RUNNING AT' + URL
           print 'PLEASE CHECK THE LOGIN CREDENTIALS AND IF THE ADMIN SERVER IS RUNNING'
           print dumpStack()
           exit()

def getStatus(server):
   cd('/ServerLifeCycleRuntimes/' + server.getName())
   return cmo.getState()

def getHealth(server):
   cd('/ServerRuntimes/' + server.getName())
   tState = cmo.getHealthState().getState()
   if (tState == 0):
     return 'OK'

def getThreadstat(server, type):
   cd('ServerRuntimes/' + server.getName() + '/ThreadPoolRuntime/ThreadPoolRuntime')
   if (type == 'S'):
     return int(cmo.getStuckThreadCount())
   elif (type == 'H'):
     return int(cmo.getHoggingThreadCount())

def monitorReport():
    servers = cmo.getServers()
    domainRuntime()

    for msrvr in servers:
       mName  = msrvr.getName()
       mState = ''
       hState = ''
       sCnt   = 0
       hCnt   = 0

       if (mName != 'AdmSvr'):
         mState = getStatus(msrvr)
         if (mState == 'RUNNING'):
           hState = getHealth(msrvr)
           sCnt   = getThreadstat(msrvr, 'S')
           hCnt   = getThreadstat(msrvr, 'H')
           print >>fileStuck, '%s %s %5d' %(mName, "=", sCnt)
           print >>fileHogging, '%s %s %5d' %(mName, "=", hCnt)

if __name__== "main":

   from java.io import FileInputStream
   import sys
   import os
   import getopt
   import datetime

   import os
   cwd=os.path.dirname(os.path.realpath(__file__))

   propInputStream = FileInputStream(cwd+'input.properties')
   configProps = Properties()
   configProps.load(propInputStream)
   domainName=configProps.get('domain.name')
   URL=configProps.get('admin.url')
   Configfile=configProps.get('config.file')
   Keyfile=configProps.get('key.file')
   now = datetime.datetime.now()

   redirect("/dev/null",'false')
   fileStuck = open("/tmp/fileStuck.txt", 'w')
   fileHogging = open("/tmp/fileHogging.txt", 'w')
   print "URL is " +URL
   print "Configfile is " +Configfile
   print "Keyfile is " +Keyfile

   if os.path.exists(Configfile) and os.path.exists(Keyfile):
      print "CONNECTING TO THE ADMIN SERVER RUNNING AT " +URL
   else:
      print "UNABLE TO READ USER KEY AND CONFIG FILES " +Configfile+ " AND " +Keyfile
      sys.exit(2)

   conn(URL,Configfile,Keyfile)
   monitorReport()
The Wrapper Shell Script
Save the file in the name weblogic_monitor_stuck.sh in the same directory where you are placing the other two files
#!/bin/bash
now=$(date +"%Y-%m-%d")
BASEDIR=`dirname $0`
recp=`cat $BASEDIR/input.properties | grep emailID | awk -F "=" {'print $2'}`
HN=`hostname -f`
DOM=`cat $BASEDIR/input.properties | grep DOMAINDIR | awk -F "=" {'print $2'}`
source $DOM/bin/setDomainEnv.sh
java weblogic.WLST -skipWLSModuleScanning $BASEDIR/wls_monitor_stuck.py

echo "Stuck Threads" > /tmp/allThreadsDetails.txt
cat /tmp/fileStuck.txt >> /tmp/allThreadsDetails.txt
cat /tmp/fileHogging.txt  >> /tmp/allThreadsDetails.txt

###################
takedump()
{
LOOP=6
        # Interval in seconds between data points.
        INTERVAL=30
        DIRECTORY="/tmp/threaddump"
                if [ -d "$DIRECTORY" ]; then
                cd $DIRECTORY
                else
                mkdir $DIRECTORY
                fi
        for ((i=1; i <= $LOOP; i++))
        do
                #PID=`ps -feww | grep java | grep $MGRS  | grep -v grep |  awk {'print $2'}`
                $JSPA/bin/jstack -l $PID > $DIRECTORY/threaddump_L_`date +%d%b%Y_%H%M%S`.log
                $JSPA/bin/jstack -F $PID > $DIRECTORY/threaddump_F_`date +%d%b%Y_%H%M%S`.log
                echo "thread dump #" $i
                        if [ $i -lt $LOOP ]; then
                              echo "Sleeping..."
                              sleep $INTERVAL
                        fi
        done
        $JSPA/bin/jmap -dump:format=b,file=$DIRECTORY/heapJMap_MgrSvr_pid"$PID"_`date +%d%b%Y_%H%M%S`.bin $PI
}

###################
file="/tmp/fileStuck.txt"
while IFS= read -r line
do
        MGRS1=`echo "$line" | awk {'print $1'}`
        COU1=`echo "$line" | awk {'print $3'}`
        JSPA=`ps -feww | grep $MGRS |  grep "Dweblogic.Name" | grep -v  grep  | awk {'print $8'} `
        $JSPA -version
        if [ $COU1 -gt 10 ]; then
                echo "Stuck threads available in $MGRS in $HN. So taking dumps......"
                if [ -z /tmp/fileStuckConter.txt ]; then
                        echo "0" > /tmp/fileStuckConter.txt
                fi
                COUTMP=`cat /tmp/fileStuckConter.txt |  grep -v  grep`
                if [ $COUTMP -lt $COU1 ] ;then
                        echo "$COU1" > /tmp/fileStuckConter.txt
                        takedump
                echo | mail -s "Stuck threads occured in $HN" $recp
                fi
        fi
done <"$file"

file2="/tmp/fileHogging.txt"
while IFS= read -r line
do
        MGRS=`echo "$line" | awk {'print $1'}`
        COU2=`echo "$line" | awk {'print $3'}`
        #JSPA=`ps -feww | grep $MGRS | grep -v  grep  | awk {'print $8'} `
        JSPA=`ps -feww | grep $MGRS |  grep "Dweblogic.Name" | grep -v  grep  | awk {'print $8'} `
        $JSPA -version
        if [ $COU2 -gt 10 ]; then
                echo "Stuck threads available in $MGRS in $HN. So taking dumps......"
                if [ -z /tmp/fileHogCounter.txt]; then
                        echo "0" > /tmp/fileHogCounter.txt
                fi
                COUTMP2=`cat /tmp/fileHogCounter.txt |  grep -v  grep`
                if [ $COUTMP2 -lt $COU2 ] ;then
                        echo "$COU1" > /tmp/fileHogCounter.txt
                        takedump
                echo | mail -s "Hogging threads occured in $HN" $recp
                fi
        fi
done <"$file2"
Credits: These scripts were created by Mohan Babu Vunnam. We @middewareinventory thank him for sharing this script with us so does the rest of the world.
Hope it helps.
Ask if you have any questions over the comments section. We will get back to you as soon as possible or you can join in our Whatsapp group for immediate assistance and support.

Follow me on Linkedin My Profile Follow DevopsJunction onFacebook orTwitter For more practical videos and tutorials. Subscribe to our channel
Signup for Exclusive "Subscriber-only" Content