The Objective of this post is cover the Weblogic SNMP monitoring in a practical manner. This post will have both theoretical and practical information and a video to help you understand things better.
Let's start!.
What is SNMP and How it works
SNMP - Simple Network Management Protocol is a protocol and a specification widely used for collecting information from, and configuring, network devices, such as servers, printers, hubs, switches, and routers on an Internet Protocol (IP) network. That's OK but what is relation between SNMP with a middleware component like WebLogic Server?. Want to know? Then Continue to read.
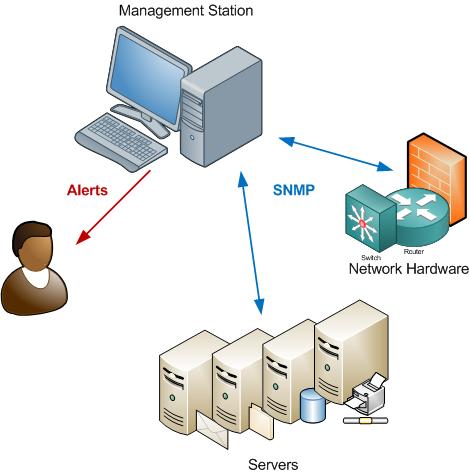
SNMP has a simple architecture based on a client-server model. The servers are called managers, collect and process information about devices on the network.
The clients, called agents. An agent can be any network endpoint like Hub, Switch, Router, etc. (or) a Servers. (So why cannot WebLogic be ?)
Weblogic and SNMP
We can use the Simple Network Management Protocol (SNMP) to provide monitoring data to enterprise-wide management systems. With SNMP, we configure agents in WebLogic to gather and send data about managed resources in response to a request from managers. We can also configure agents to issue reports to managers when they detect predefined thresholds or conditions on a managed resource.
Some of the thresholds and conditions would be as follows
- When a Server instance goes down
- When a Server instance goes to Admin mode
- When instance have stuck thread
- When any configuration attribute changed in WebLogic domain like someone changes listen-port number on server instances
- When Connection Pool usage is reaching the maximum threshold.
The preceding examples are very few, and the possibility of SNMP monitoring can go more and more.
How SNMP Works in Weblogic
WebLogic Server SNMP agents query the WebLogic Server management system and communicate the results over the SNMP protocol. The WebLogic Server management system exposes management data through a collection of managed beans (MBeans).
When a WebLogic Server SNMP agent receives a request from a manager, it determines which MBean corresponds to the OID in the manager’s request. Then it retrieves the data and wraps it in an SNMP response.
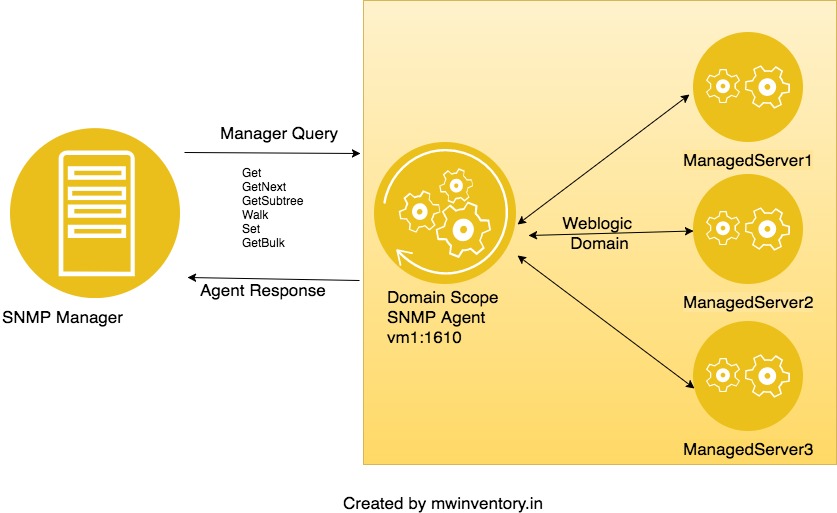
So its a manager initiated request and this is how it looks like in a pictorial representation
In the preceding illustration, SNMP Manager Connects to SNMP Agent ( Not to the Trap Destination) to request for a specific data by explicitly mentioning the OID
Here Get, GetNext, Walk and others are the SNMP Tasks/Requests SNMP manager could initiate
For example, the following snmp.cmdline.manager command will give you the complete list of servers in your domain from ServerLifeCycleRuntime tree
mwidomain aksarav$ java weblogic.diagnostics.snmp.cmdline.Manager SnmpWalk -m BEA-WEBLOGIC-MIB -M /weblogic/diagnostics/snmp/mib -c saravak serverLifeCycleRuntimeName -p 1610
serverLifeCycleRuntimeName.''2167c59bd9a1f6a92fec9fb870c3c1dd'H'=AdminServer
serverLifeCycleRuntimeName.''37f3f44ef992bc1c33107785af6f2c8a'H'=mwiserver4
serverLifeCycleRuntimeName.''40adfead9a56e60483183ae5a487b498'H'=mwiserver1
serverLifeCycleRuntimeName.''43f1085eb5d674d290610af1e4ab10b3'H'=mwiserver3
serverLifeCycleRuntimeName.''98213829e01fa338a2c9ded2f1636711'H'=mwiserver2
DONE
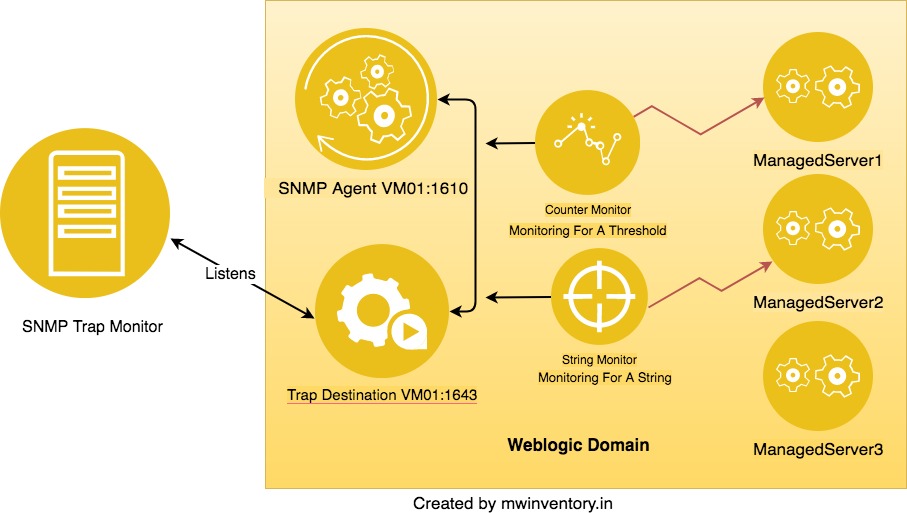
We can also configure agents to issue unsolicited reports (notifications) to managers when they detect predefined thresholds or conditions on a managed resource. that's where monitors and TrapDestinations are used.
When a Monitor (StringMonitor, Gaugemontor or any) finds a matching threshold or condition it will generate trap notification and sends it to TrapDestination.
TrapDestination will be constantly monitored by TrapReceiver/Monitor will get the Trap notification generated as soon its created. In other words, TrapMonitor will connect itself to the TrapDestination and listen for any activity.
Hope the following pictorial representation helps you understand this
In the preceding illustration, you can see SNMP Trap Monitor is listening on the Trap Destination Port. We will cover this practically in the upcoming chapter "Validate the Trap Notification using Weblogic Built-in SNMP Trap Monitor
Models of SNMP in Weblogic
In each WebLogic Server domain, you can create multiple SNMP agents and organize them into a centralized or de-centralized model for SNMP monitoring and communication:
- In a centralized model, you configure an SNMP agent only on the Administration Server. This agent communicates with all Managed Servers in the domain. Your SNMP manager communicates only with the SNMP agent on the Administration Server. This model is convenient but introduces performance overhead in WebLogic Server. Also, if the Administration Server is unavailable, you cannot monitor the domain through SNMP.
- In a de-centralized model, you configure SNMP agents on each Managed Server. Your SNMP manager must communicate with the agents on individual Managed Servers.
Hope we set the context and ready to go Realtime mode and create SNMP and see how it works. We will cover the Centralized Model in this post ( we will soon update it with De-Centralized Model)
Assumptions:
- This post believes that you know WebLogic and its terminologies
- This post considers that you already have a working WebLogic setup with managed servers and clusters etc.. In case you are looking for how to install WebLogic and create a domain. Read these articles first and then come back here. http://www.mwinventory.in/blog/weblogic-12c-installation-linux/ and http://www.mwinventory.in/blog/weblogic-domain-creation-script-wlst/
Environment:
I am using my WebLogic 12c domain for this post; same instructions could be applied for 11g and 10. I am going to setup the Centralized Model ( Domain Scope SNMP Agent hosted on AdminServer) in this post
Note*: Keeping the page loading time in mind, I have not attached the snapshot for all the preceding steps but the video available at the end of this post with more detailed information.
Configure Domain SNMP Agent
- Login to the Weblogic Administration Console.
- Click Lock&Edit in case you have not done it already
- On the left pane (DomainStructure wizard) click on Diagnostics and then SNMP
- On the right, you will be able to see the Domain SNMP Agent , General Configuration Tab
- Check the Enabled box and mention the SNMP UDP Port and AgentX Port and check Community based access enabled
- In trap Version, Select V2
Create String Monitors
- Click Lock&Edit in case you have not done it already
- On the left pane (DomainStructure wizard) click on Diagnostics and then SNMP
- On the right, you will be able to see the Domain SNMP Agent
- Now Click on the String Monitors tab and click on New and create new String monitor
- In the Next screen Enter the Name for the String Monitor and in Monitored MBean Type select "ServerLifeCycleRunTime" from the drop-down
- Click Next and in Monitored Attribute Name Select "State" from the drop-down and click Next
- Now Enter the String to Compare in the String to Compare text box [ I want to be notified when the corresponding Managed Server Transition from RUNNING to FORCE_SHUTTING_DOWN So I am using FORCE_SHUTTING_DOWN as the string to Compare]
- click Finish
- Once you are redirected to the String Monitors tab, you will be able to see the String Monitor you have just created in the table. Click on the newly created String Monitor
- Update the Monitored MBean Name field with the Managed Server Name you want to be monitored.
- click on Save and Activate Changes
Create Trap Destinations
- Click Lock&Edit in case you have not done it already
- On the left pane (DomainStructure wizard) click on Diagnostics and then SNMP
- On the right, you will be able to see the Domain SNMP Agent
- Now click on the Trap Destinations tab
- Click New and create new SNMP Trap Destination
- Enter the Name as you desired
- Community value should match to the Community Password in the Domain SNMP Agent -> General tab ( if you have not updated anything, by default both will be public)
- Change the Port number (optional, I am using 1622 as port number) or let it be default [Make a note of this port number, this is where you should point you SNMP Manager]+
Validate the Trap Notification using Weblogic Built-in SNMP Trap Monitor
Use WebLogic built-in SNMP Manager to review the trap and to verify if the trap notification is receiving to the Trap Destination
- Go to your Domain Directory/bin
- Execute . ./setDomainEnv.sh script to set environment ( There is two dots, First one is sourcing)
- Execute the following command ( use the port number you have used at Trap Destination Creation Step 8 +)
java weblogic.diagnostics.snmp.cmdline.Manager SnmpTrapMonitor -p 1622
Decoding the Trap Notification Received
The Trap Notification generated would be something like below.
- – Snmp Trap Received – -
 Version : v2
 Source : UdpEntity:127.0.0.1:1612
 Community : public
 Enterprise : enterprises.140.625
 TrapOID : enterprises.140.625.0.70
 RawTrapOID : 1.3.6.1.4.1.140.625.0.70
 Trap Objects : {
 { enterprises.140.625.100.5=Sat Jan 06 17:43:07 IST 2018 }
 { enterprises.140.625.100.10=mwiserver1 }
}
 Raw VarBinds : {
 { sysUpTime.0=60049 }
 { snmpTrapOID.0=enterprises.140.625.0.70 }
 { enterprises.140.625.100.5=Sat Jan 06 17:43:07 IST 2018 }
 { enterprises.140.625.100.10=mwiserver1 }
}
Here we have a server name, but how do we know if it is for SHUTDOWN event? It would be more confusing if you have two string monitoring setup, one for SHUTDOWN and another for RUNNING
That's where the OID comes to the picture.
In the preceding sample SNMP Trap, look at this line
snmpTrapOID.0=enterprises.140.625.0.70
This last two digits of OID indicates what type of action has been performed. Is it a SHUTDOWN (or) START etc
70 indicates that the server was running is now shutdown
65 indicates that the server was shutdown is now Running
List of OIDs and its description could be found here https://docs.oracle.com/cd/E24329_01/web.1211/e24424/snmptraps.htm#SNMPA153
SNMP Trap notification has other informaiton like community name and trap version etc.
Community : public
Here the community is public. As a convention all network devices who used SNMP V1&V2 use public as the community name, you can change it to anything you desire.
In the video, we have covered that part as well.
The Video ( Has more information that we cannot cover in this post. Plese see)
Hope this post is helpful and I am already working regarding the advanced JMX and SNMP in Weblogic it will cover the MIB, MIB Browser and other various monitoring possibilities in Weblogic with SNMP.. Stay connected for updates.
I would like to hear your feedback. Feel free to comment how do you feel about this article
Cheers,

Follow me on Linkedin My Profile Follow DevopsJunction onFacebook orTwitter For more practical videos and tutorials. Subscribe to our channel
Signup for Exclusive "Subscriber-only" Content

