This Post is going talk about few real time requirements (or) scenarios and how to handle it.
Let's start!
Consider the following scnearios
Scenario 1
The Weblogic Cluster is having four managed servers and during the load/stress test you are finding that there is improper load balancing between the cluster members. To be more accurate two servers handling all the load when the other two servers are idle
Scenario 2
In the cluster health monitoring you are noticing that some of the server's dropout frequency is very frequent when some of them are rarely
Scenario 3
You wanted to track the weblogic web server plugin and its status and how many cluster members and handling the load and wanted to know the statistics like how many requests are processed, How many failed requests, How many connections refused in terms of web server to appserver etc.
Well, this post is going to be a helpful resource to handle all these scenarios, By Discussing "how to troubleshoot the scenario 1, I hope we would be able to come to an understanding on how to handle other two as these three are interrelated.
Let us consider an infrastructure setup as shown below

Let's say there are four consequent incoming requests, Now in a Round Robin Load balancing - weblogic cluster has to allocate 1 request to each server.
But for instance, Let us consider managed server 1 and 2 handles all the load while managed server 3 and 4 is idle. Then there is a problem of uneven load balancing.
Let us start the troubleshooting Right from Apache Http Server
We have to enable Debug in Apache Http Server Weblogic Plugin configuration in order to track the load balancing at plugin level. Under the Location specification of your application, add the highlighted (colored) plugin configuration parameters.
<Location /testapp>
 SetHandler weblogic-handler
 Debug ALL
 DebugConfigInfo on
 WLLogFile /tmp/wlproxy.log
 PathTrim testapp
 # or you can set PathTrim to /testapp
 WeblogicCluster VM-01:7003,VM-01:7004,VM-02:7003,VM-02:7004
 ErrorPage http://myerrorpage1.mwinventory.in
</Location>
Note*: If you have weblogic configuration mentioned in weblogic.conf file and you are loading the weblogic plugin parameters by including the file. You need to make the changes in weblogic.conf file
Restart the apache in your preferred way (or) you could also reload the configuration as well using the following command
service httpd reload
Once the reload/restarting is completed, Try to hit the application with the Fully Qualified URL ( including context root )
for example www.mwinventory.in/testapp
here testapp is the application name in which we have added the debug configuration
As you hit the application you would now be able to see the log file generated at /tmp/wlproxy.log
Note*: Sometimes, Even if you mention different log file name and path in WLLogFile you will see the log getting written in /tmp/wlproxy.logthis is default WLLogFile Name. So when you bang your head why the log is not writing, I would recommend you to go and check this file once . If its windows it would be written in c:\TEMP\
wlproxy.log
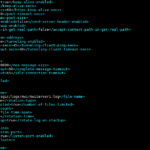
In the file you would be able to see the logs getting written like follows
Fri Jan 4 11:58:52 2018 <2483219851715321> ================New Request: [GET /testapp] =================
Fri Jan 4 11:58:52 2018 <2483219851715321> Using Uri /testapp
Fri Jan 4 11:58:52 2018 <2483219851715321> After trimming path: '/testapp'
Fri Jan 4 11:58:52 2018 <2483219851715321> The final request string is '/testapp'
Fri Jan 4 11:58:52 2018 <2483219851715321> SEARCHING id=[] from current ID=[VM-01:7003,VM-01:7004,VM-02:7003,VM-02:7004]
This file would be a great help to you to identify which application server is handling the request.
The __WebLogicBridgeConfig page
The Next KeyItem/Resource to help you identify the issue is __WebLogicBridgeConfig feature
To see the weblogic Bridge Config page for the particular application (testapp) . you have to hit your application URL with the __WebLogicBridgeConfig as a query string like given below
http://www.mwinventory.in/testapp?__WebLogicBridgeConfig
You should be able to see a page like given below with Server List, Configuration information and Runtime Statistics


If you are not seeing all of your servers here even after few refreshing, you need to check the below things
- Make sure DynamicServerList: 'ON' in the WeblogicBridgeConfig page if it is set to Off , Cluster would not recognize some managed servers ( mostly newly added servers)
- Check the DropOut Frequency off the cluster members in your cluster
How to check the Dropout Frequency of a Cluster Member
- Login to Console
- In the Left Domain Structure tree select the Environments Node as it expands click the Clusters
- Once the Cluster page is loaded, Click on the Desired Cluster
- Go to monitoring tab and in the server list table check the dropout frequency of each cluster member
- If for some managedServers, you see frequently which means it has higher rate of dropout

What if there is a frequent dropout on few managed servers ?
There could be more number of probable root causes for the managed server dropout, some of them are listed below
- Firewall/Network errors between the the nodes (vm01, vm02)
- Configuration issues in the server and http channel
- Unicast messaging ping failures
- Known Bug like https://docs.oracle.com/cd/E12840_01/wls/docs103/issues/known_resolved.html CR370084 [ prior to 10.3]
- Multicast configuration errors
The list would go so lengthy if we have to mention all the probable errors here.
Solutions (more like tips)
Sometimes solutions would be very simple like correcting the ip address (or) a port number or could be tough like network component remapping. I would let you win your battle.
Here are some of the troubleshooting tips you could follow
Tip1
VALIDATE CLUSTER CONFIG using weblogic.Admin Command line https://docs.oracle.com/cd/E11035_01/wls100/admin_ref/cli.html#wp1305429
Tip2
Set the system property -Dweblogic.unicast.HttpPing=true. This flag should be needed only in test environments where running processes might be suspended when pressing Ctrl-z.
Tip3:
Troubleshooting and test the multicast setup
https://docs.oracle.com/cd/E13222_01/wls/docs92/cluster/multicast_configuration.html
Tip4
Verify the Connectivity between cluster nodes and members and apache servers and application server using telnet (or) nc
vm-01# nc -w 3 -v vm-02 7003
learn more about nc here : https://www.computerhope.com/unix/nc.htm
Tip 5
Enable Cluster Debug, There is a good article available here https://blogs.oracle.com/emeapartnerweblogic/wls-cluster-debugging-some-tips-by-jon-petter-hjulstad
Hope this post helps you (at least little) and keeps you on the track.
Thanks,
A K S A R A V
Write to us at : [email protected]
Follow us on Facebook
To Join our Community in Whatsapp – Click here