Monitoring and Observability are crucial elements for Production uptime and site reliability.
Whether your infrastructure is serverless, microservices, containerized or traditional monolith you cannot run away from the observability needs.
While observability became indispensable, the product you choose for observability defines how far can you go.
There are lot of contenders in this Observability market. I have listed some of them here. DataDog, DynaTrace, AppDynamics, Solarwinds, Splunk, Elastic, New Relic
But all these products come with a cost. For those who cannot afford/want these products mostly rely on cloud platform-specific tools such as CloudWatch for AWS.
In this article, we are going to see how to use AWS CloudWatch monitoring efficiently to prevent and detect application slowness
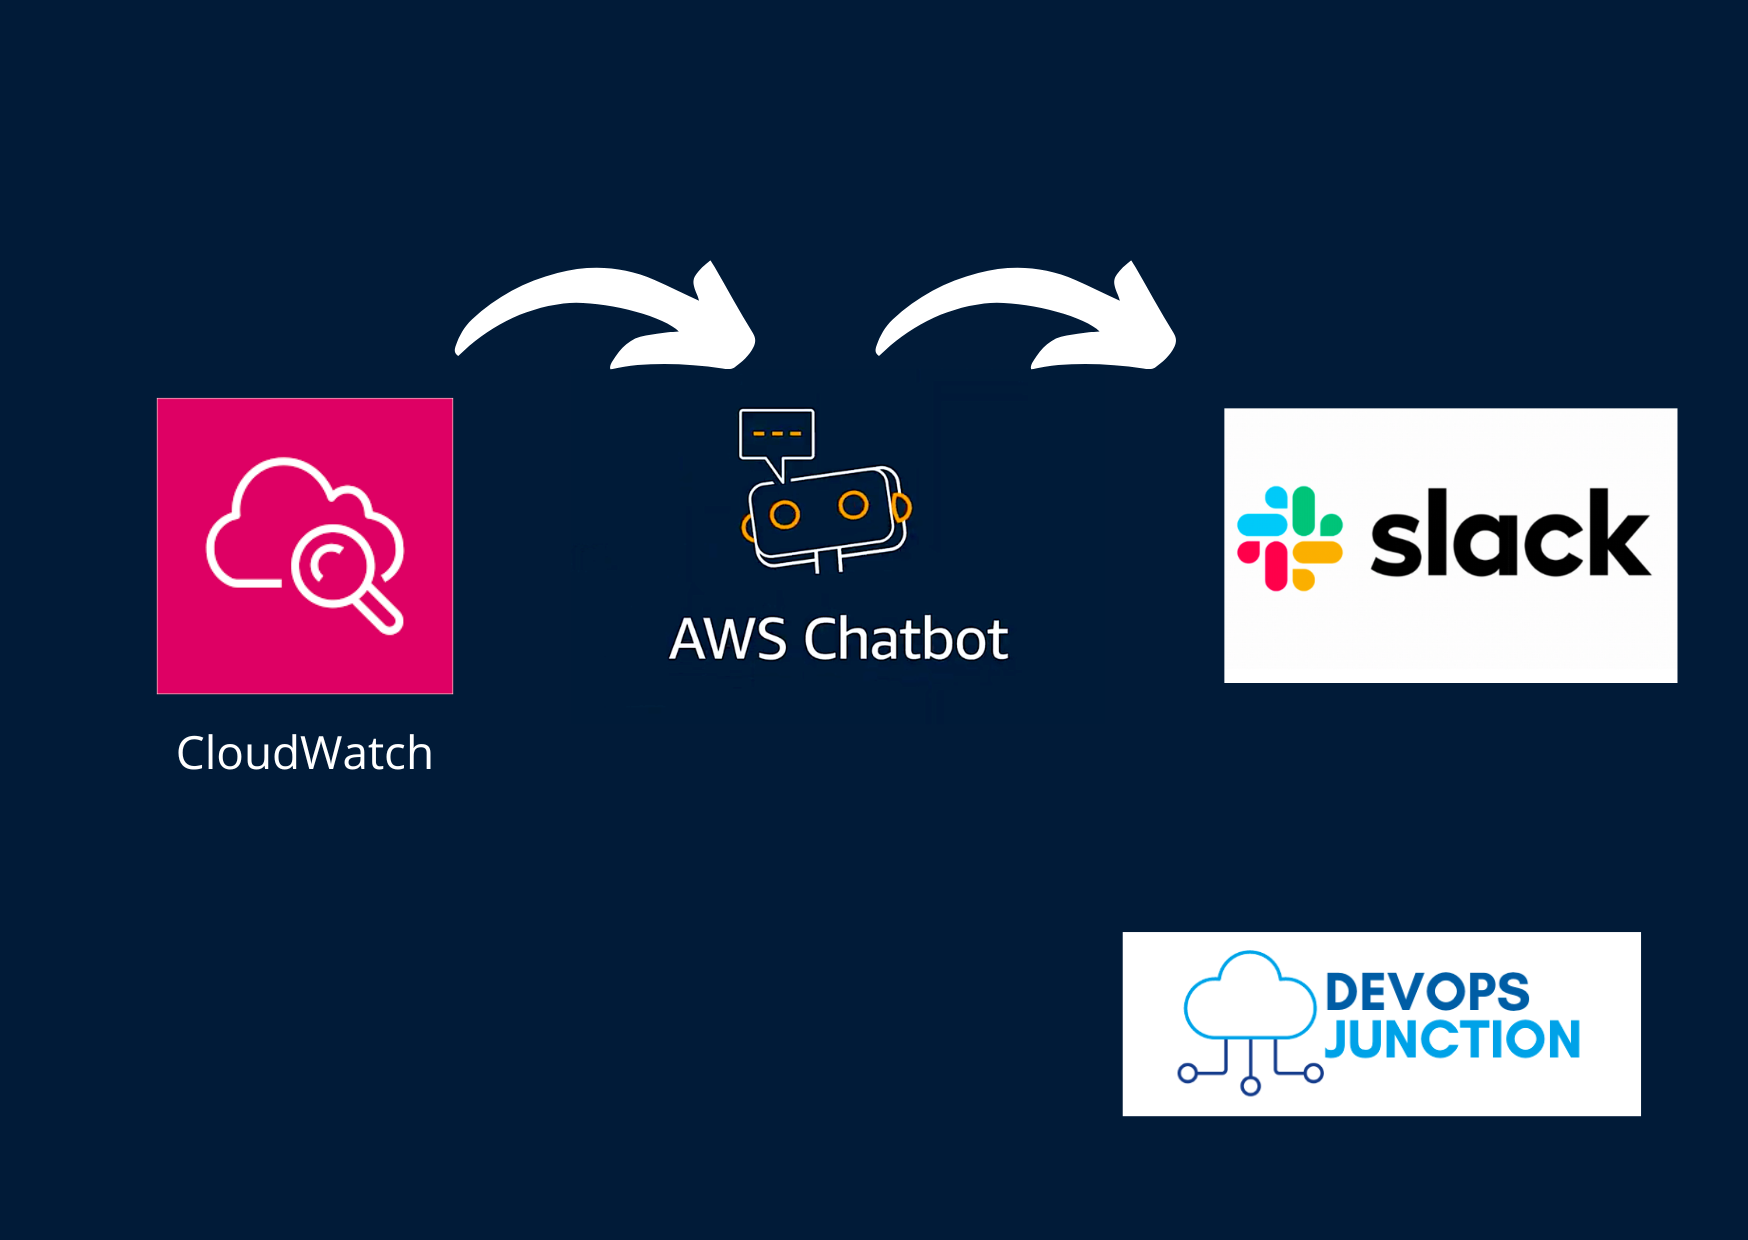
We will also learn how to send Cloud Watch alarms to Slack using AWS Chatbot integration
Detecting Application Slowness with Target Response time
Whether you have monolith infrastructure (or) microservices infrastructure like Kubernetes EKS. You would be using Application and network load balancers to expose your application to the outside world.
When you think about benchmarking and monitoring application performance and throughput time.
we mostly think of the following solutions
- Application performance monitoring (APM)
- Telemetry data produced by the Application itself ( StatsD, open telemetry)
- Custom metrics built by the Developers inside the App
These are undeniably great ways to monitor and understand your application.
but that's not all, there is one more crucial data we can use to understand the application which is network or traffic data.
Let's suppose you do not have any of these aforementioned items, and if you want to find out what the response time of your application or microservice
you can simply use the traffic statistics of your API gateway or Application Load Balancer
yes, with just Application load balancer metrics you would be able to understand your application behaviour and know when something is going wrong.
If you are reading this article then I presume that you might have some exposure to AWS Applications and network load balancers and their metrics
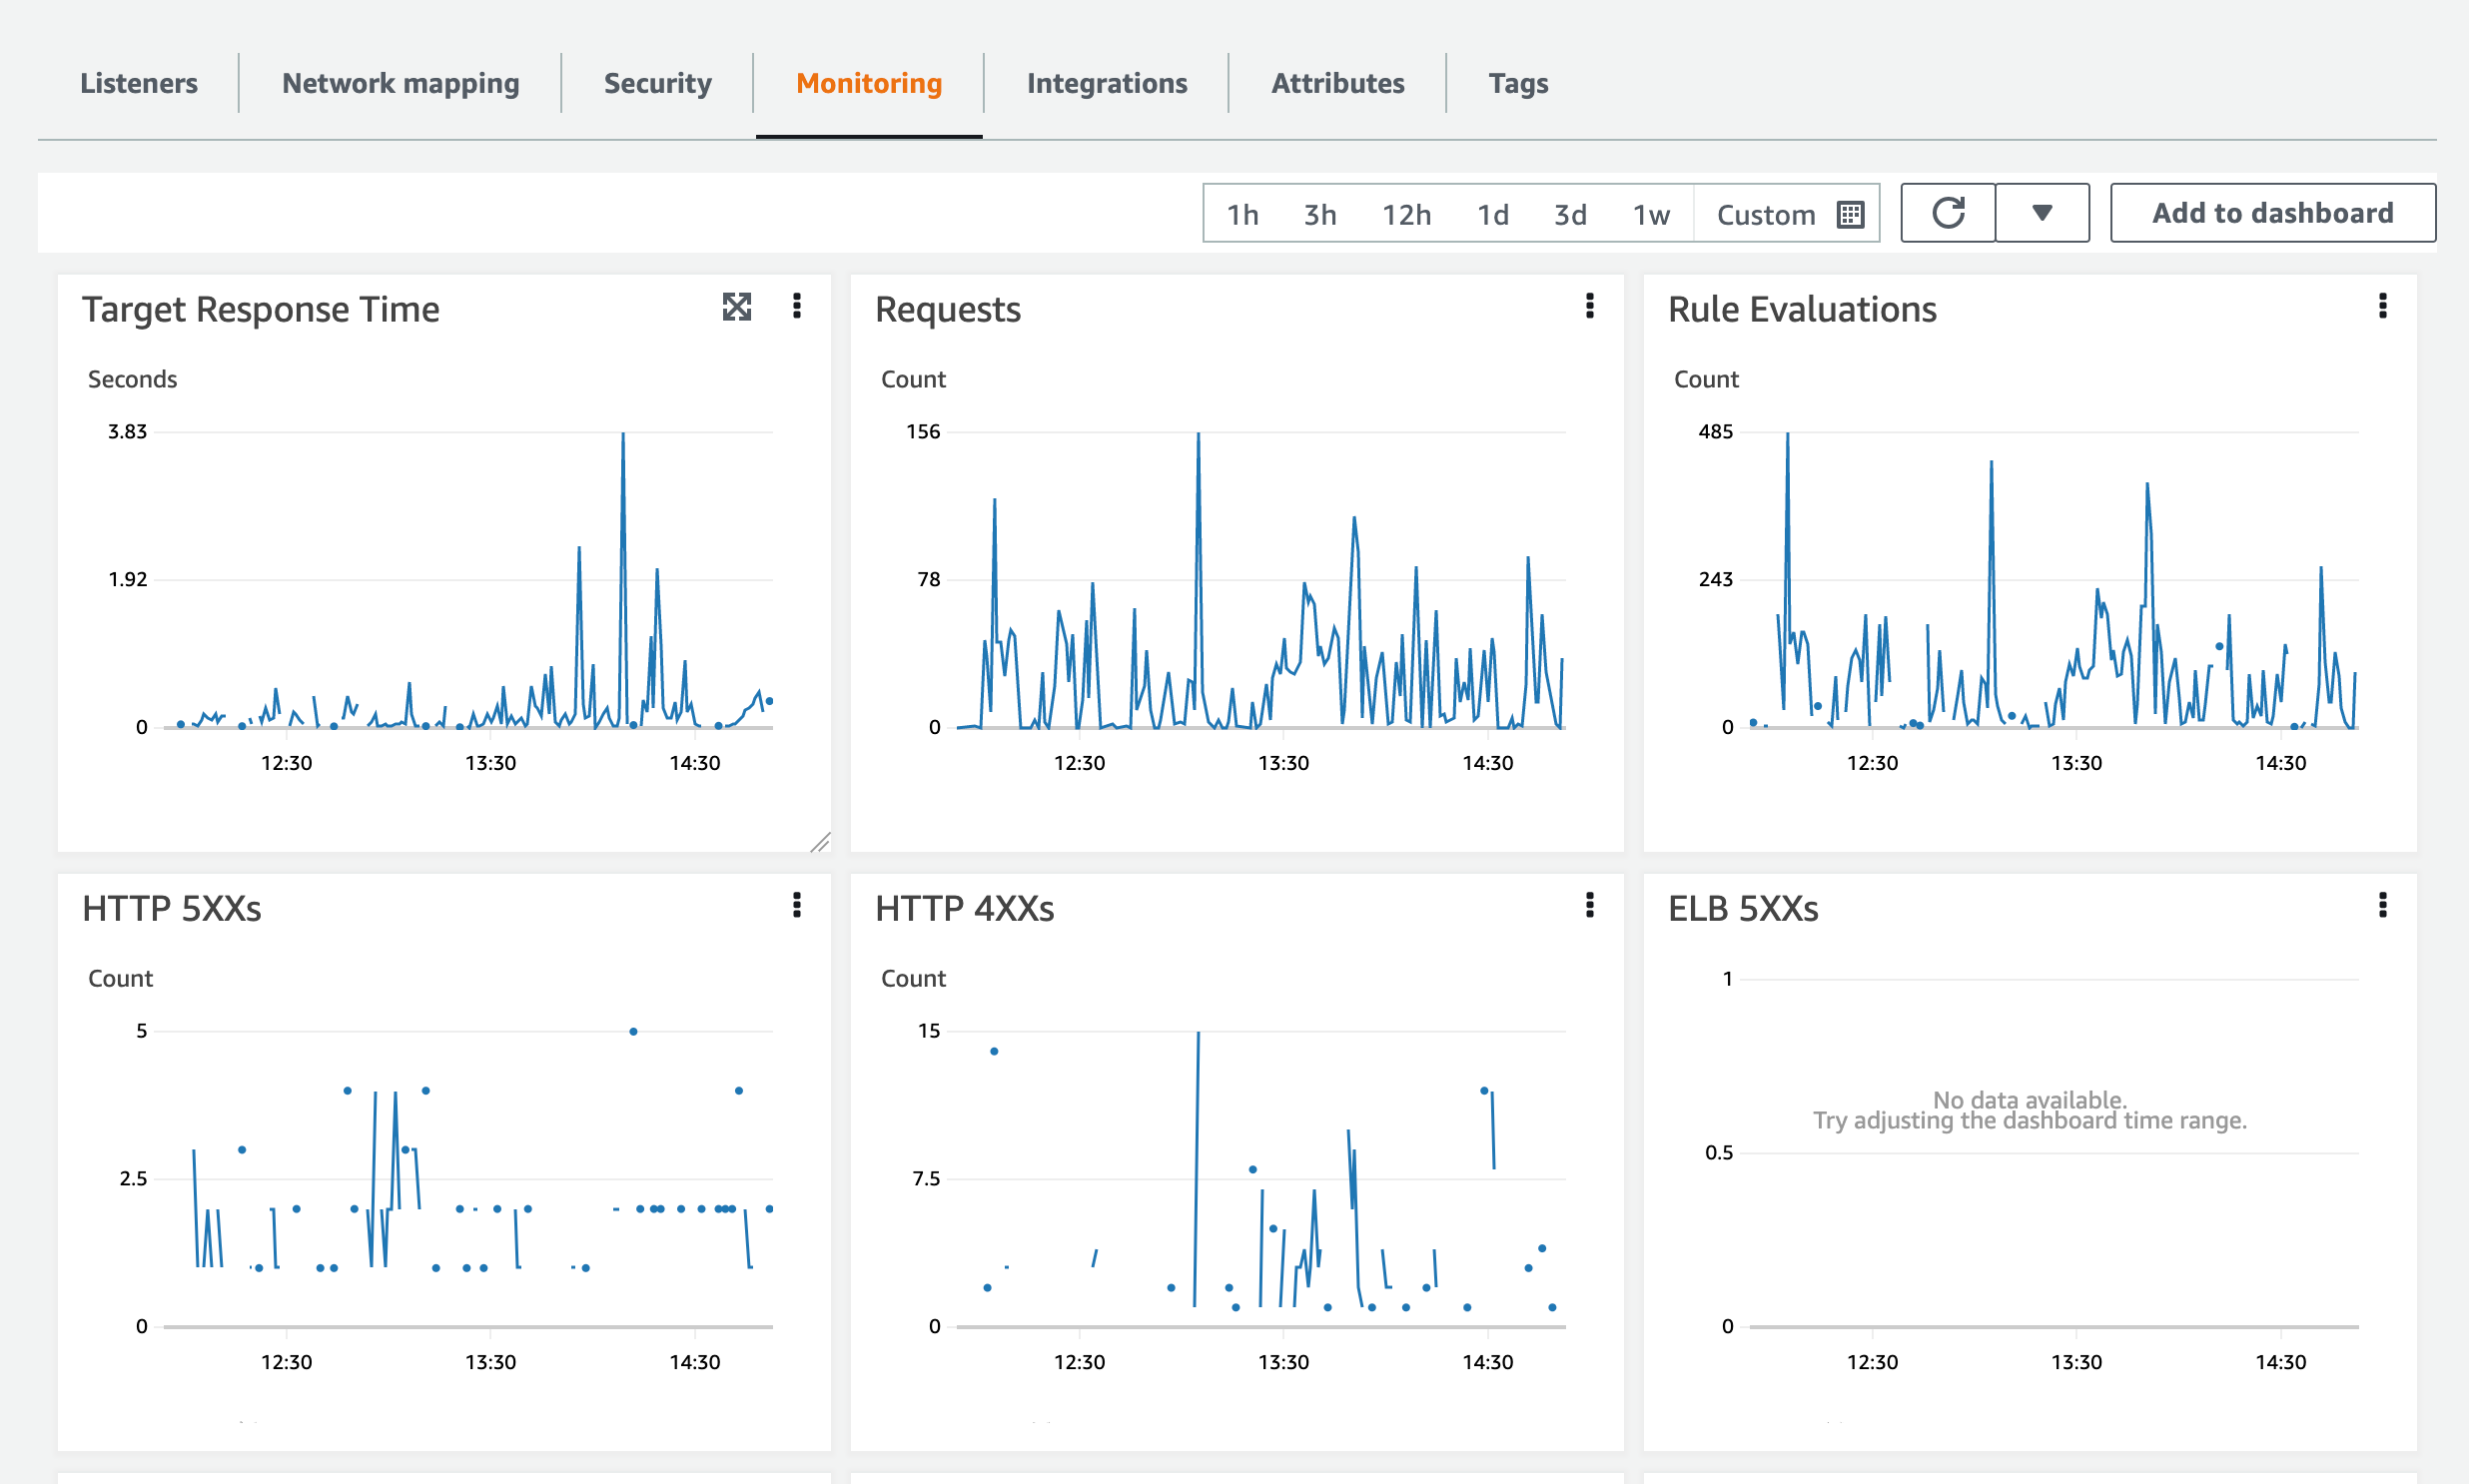
In every load balancer, you might have seen some metrics like this.
All of this information is really useful to understand your application and know when something goes wrong.
Additionally, you can also look up all the events and access logs of ALB if you have the ALB access log enabled.
With Athena, you can create beautiful reports and use them for production troubleshooting.
I have written a dedicated article on how ALB logs can be used with Athena. refer it here
Monitoring the CloudWatch ALB Metric and Creating Slack Alerts
Now in this article, we are going to see how to use ALB metrics with Cloud Watch and use it for preventive monitoring and alerts with Slack and Email notifications.
Primarily we are going to focus on the Target Response Time metric of the ALB / NLB
But you can monitor any other metric available too such as from ALB
- HTTP 4xxs
- HTTP 5xxs
- Requests
- ELB 5xxs
You can use the same process to monitor any metric available on the Cloud Watch across AWS services like EC2, RDS, ElasticCache, SQS, S3 etc.
Moving on to the implementation now.
How CloudWatch alarms are sent to Slack Channel
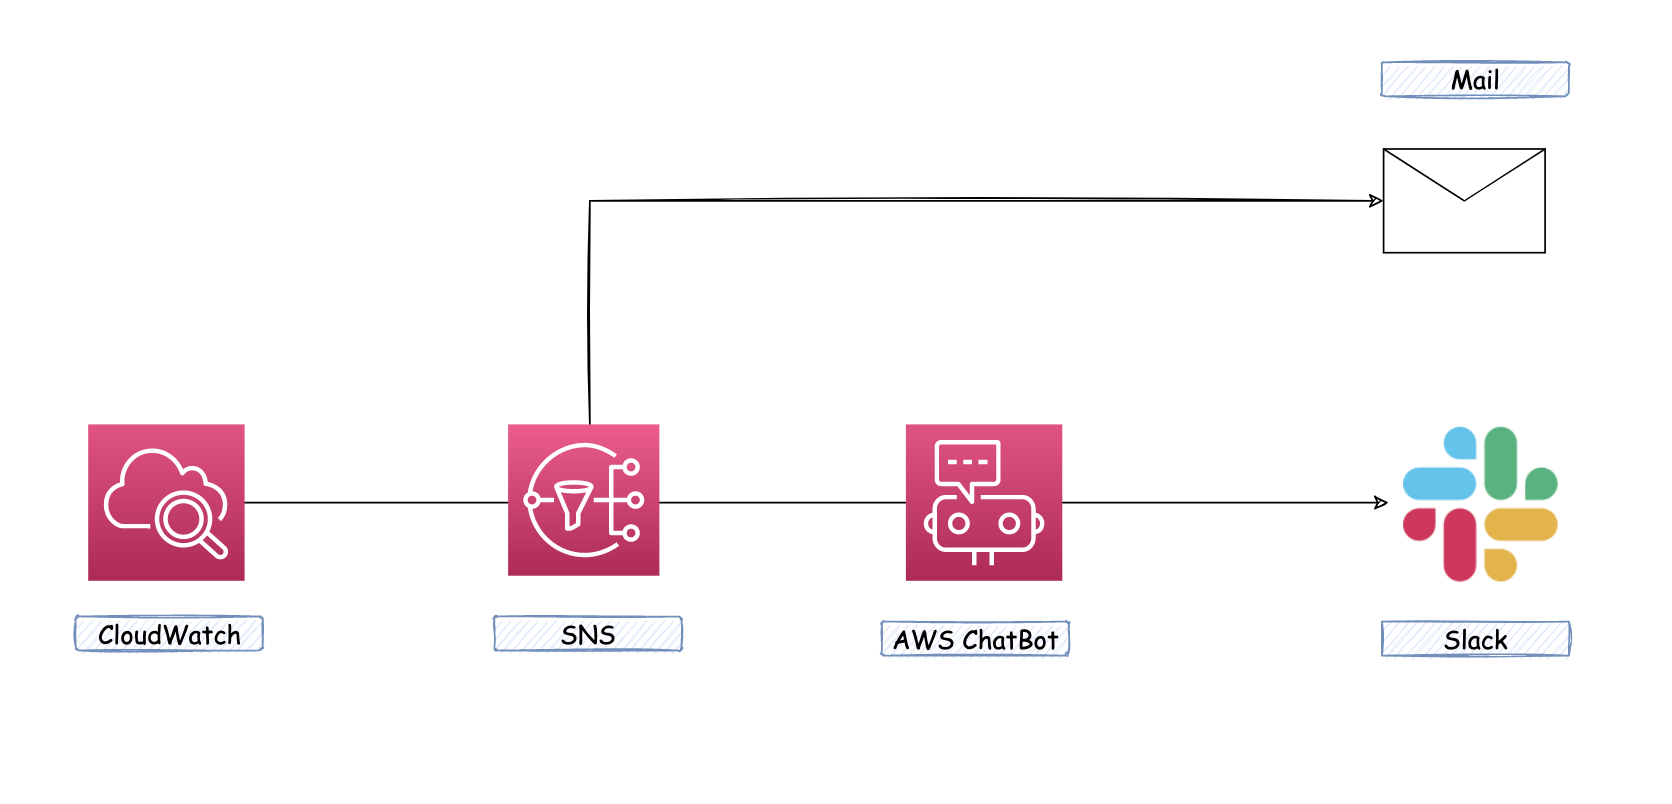
We are going to use the following AWS services to achieve this alerting and monitoring system
- Cloud Watch - To create an alarm when a certain threshold is met on a specific timeframe
- SNS Topic - To trigger a notification when the alert is breached (or) cleared
- AWS ChatOps - to integrate slack and create alert messages directly to the Slack channel
Configure Cloudwatch to send Slack Alert through AWS Chatbot
Let us work on the practical implementation of this setup in the same order the Notification is generated
As part of our implementation, we are going to do the following steps
- Creating Cloudwatch Alarms
- Creating SNS Topics
- Integrating AWS Chatbot to your Slack and SNS topic
Creating CloudWatch Alarms - For ALB Response Time
In this step, we are going to create a Cloud Watch Alarm for a specific load balancer and a specific metric in our case TargetResponseTime is the metric
As I have mentioned, the metric can be anything like Requests or Rule Evaluations etc. If you see that metric on the ALB monitoring tab then it is probably available for you to select here.
In your AWS console go CloudWatch and to Alarms and click on All-alarms under the Alarms menu
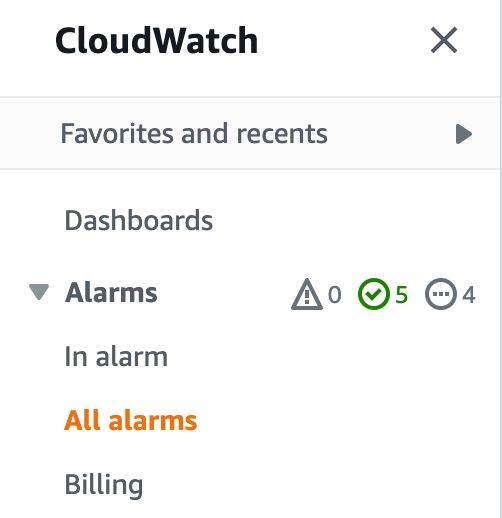
As you click on the All-alarms, you would see all your existing alarms and a button on top right Create Alarm to create a new alarm
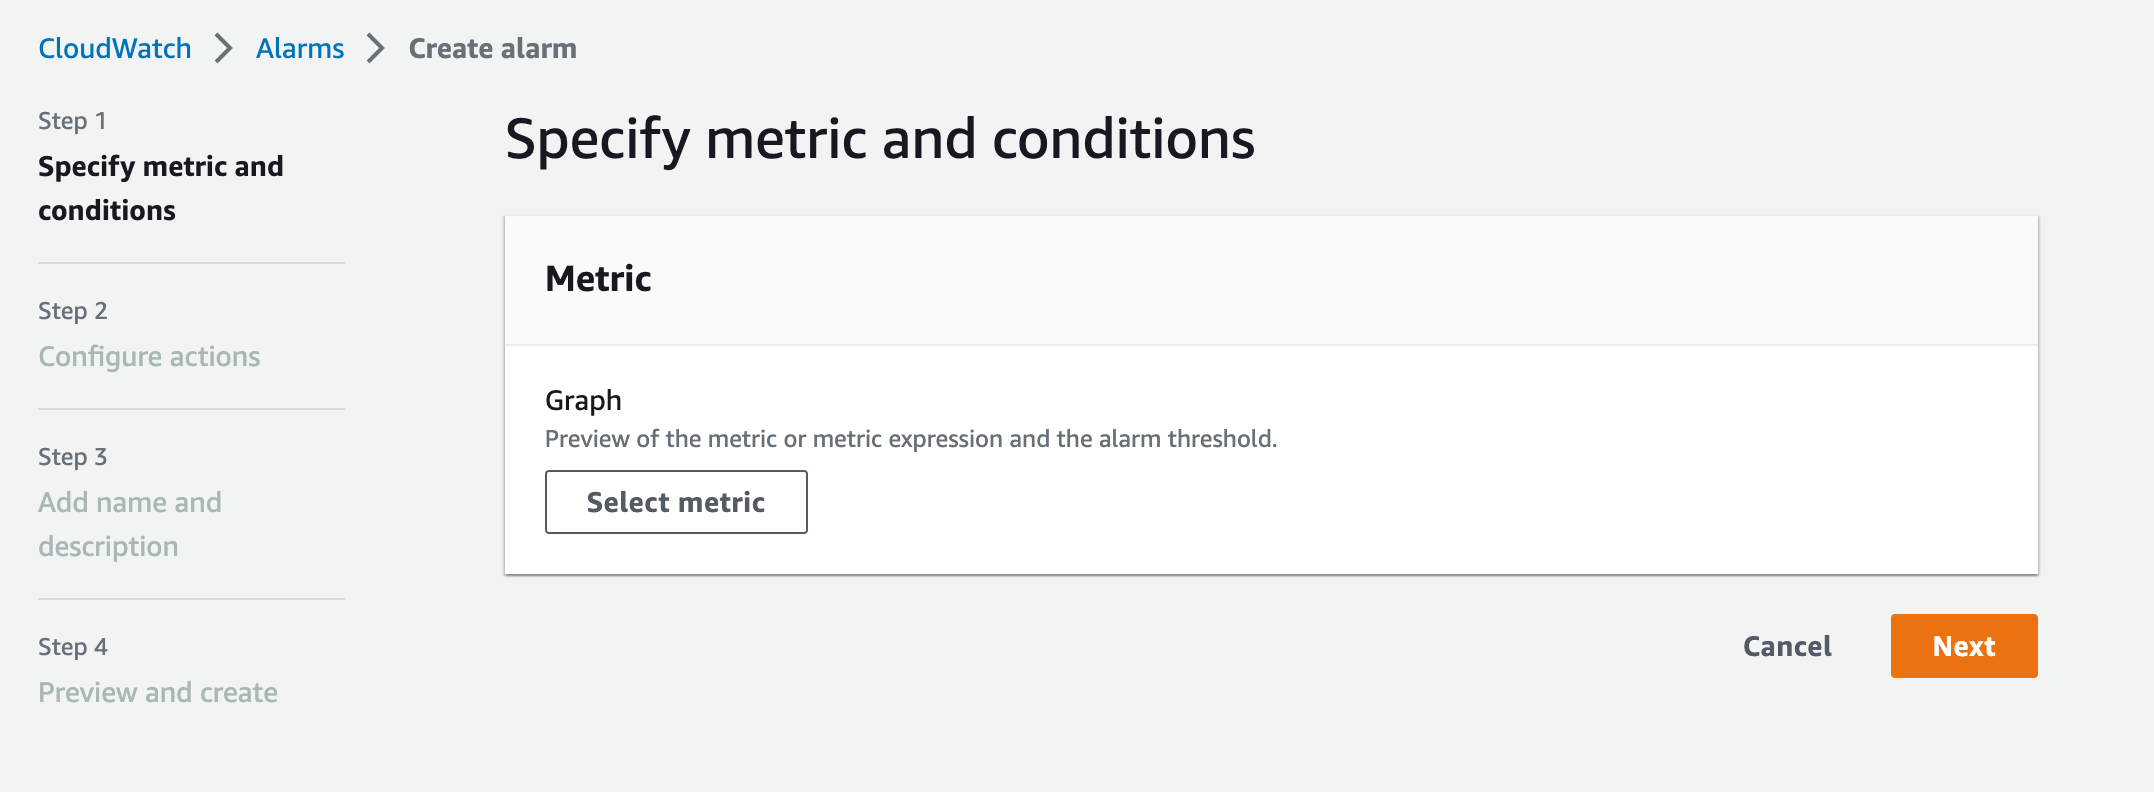
Click on Create Alarm and you would see the following screen
On the presented screen, click on Select Metric button
Once you have clicked on the Select Metric button you will be asked to Select the metric of your choice
In our case TargetResponseTime is the metric we are going to monitor and create an alarm for
So type TargetResponse on the Search and choose Application ELB > Per AppELB Metrics
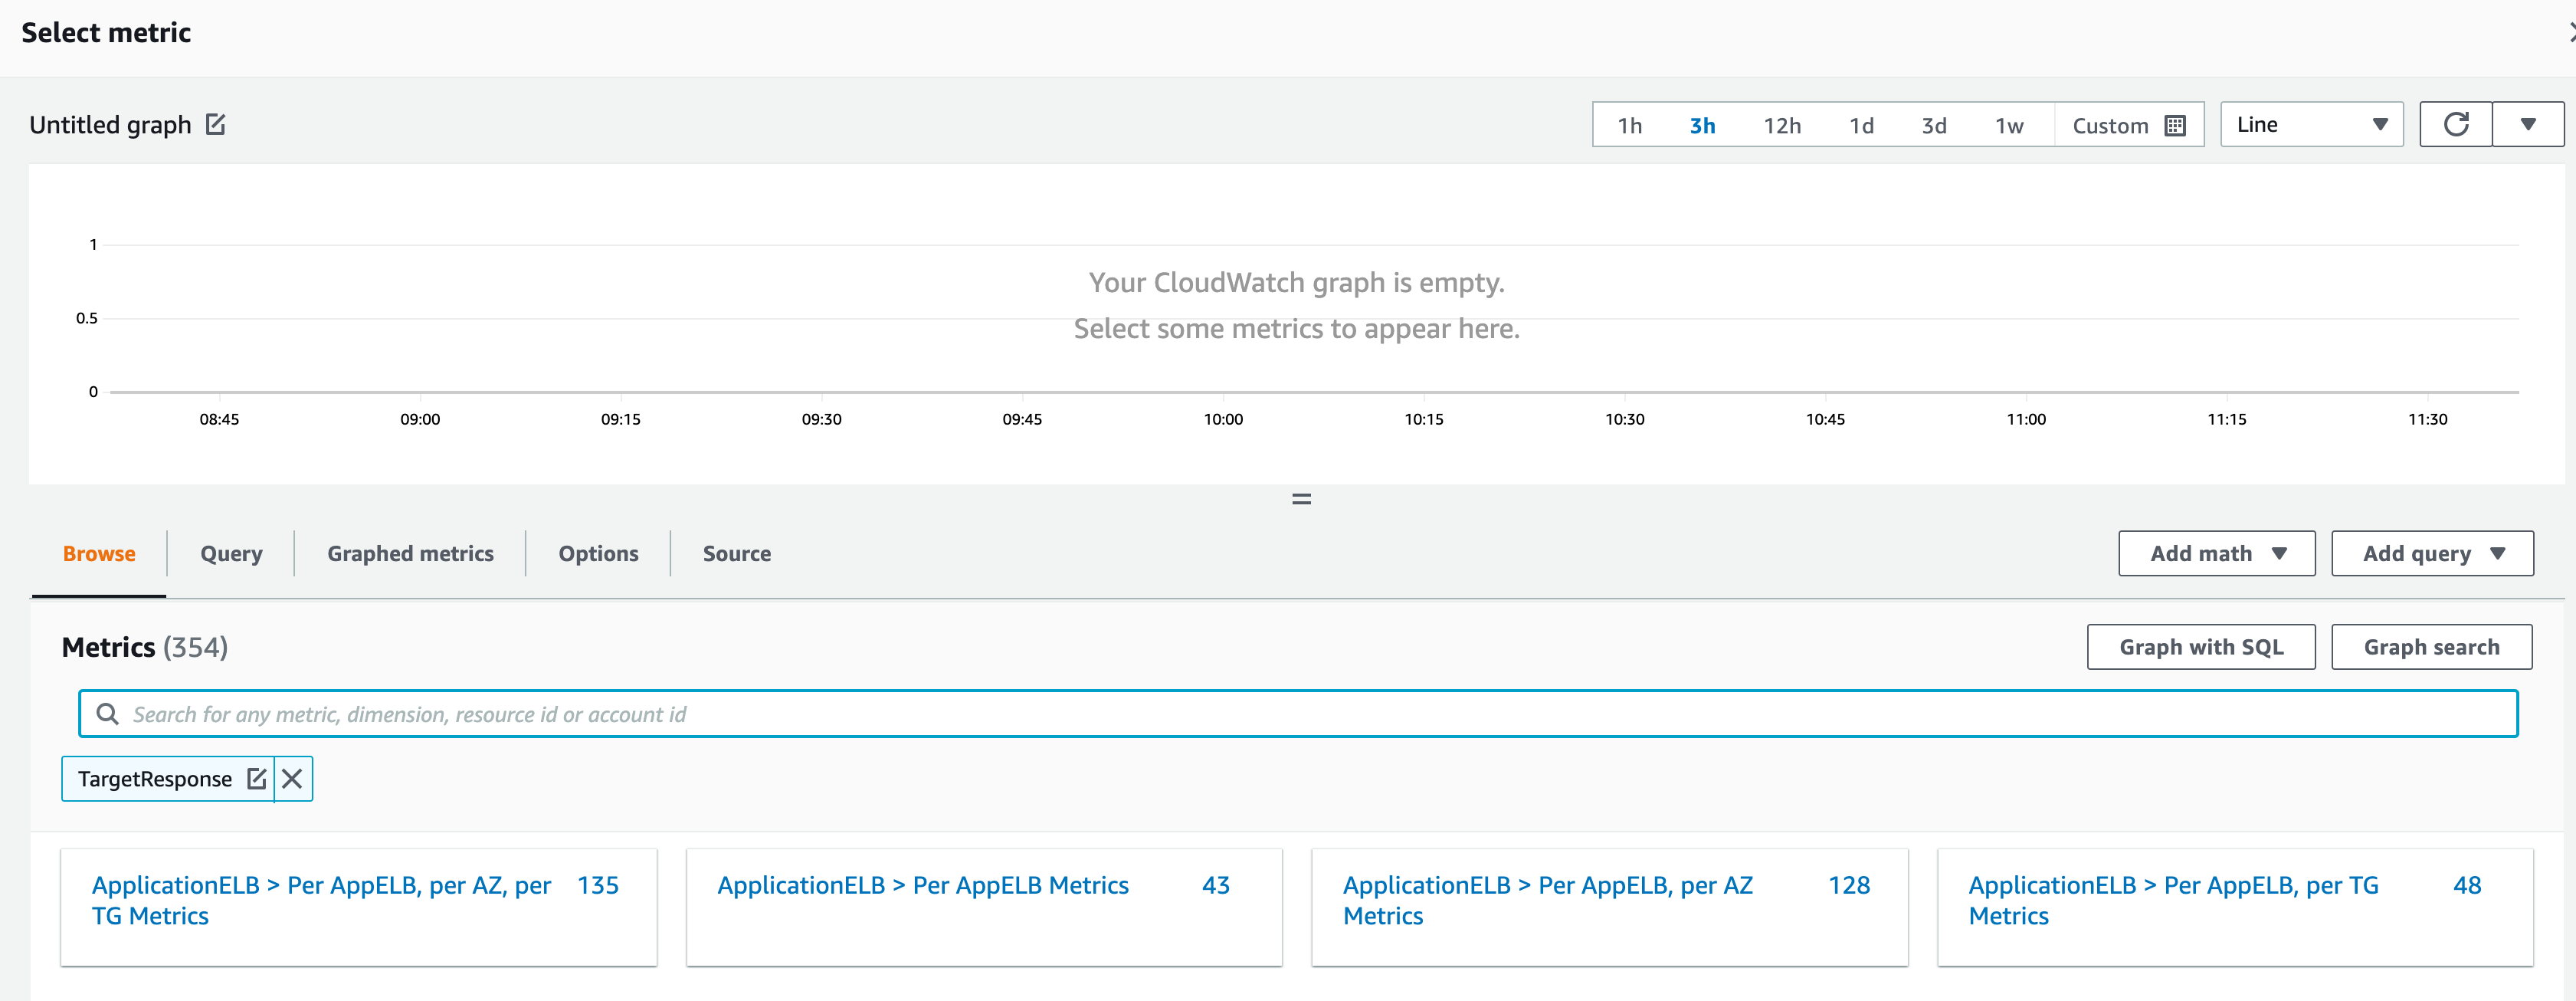
You can choose per AZ metric also but I think per ELB metric is sufficient, it would give the combined metric of all availability zones
Once you have selected the Per AppELB Metrics. you would be given a list of Application Load Balancers from your AWS account.
Choose your desired Application Load balancer by clicking on the check box
Alarms are meant to look after a single metric. you have to choose only one Metric
Once selected the desired metric, click on the Select metric button to continue
Specify Metric and Conditions
you would see the following screen with your selected Load Balancer
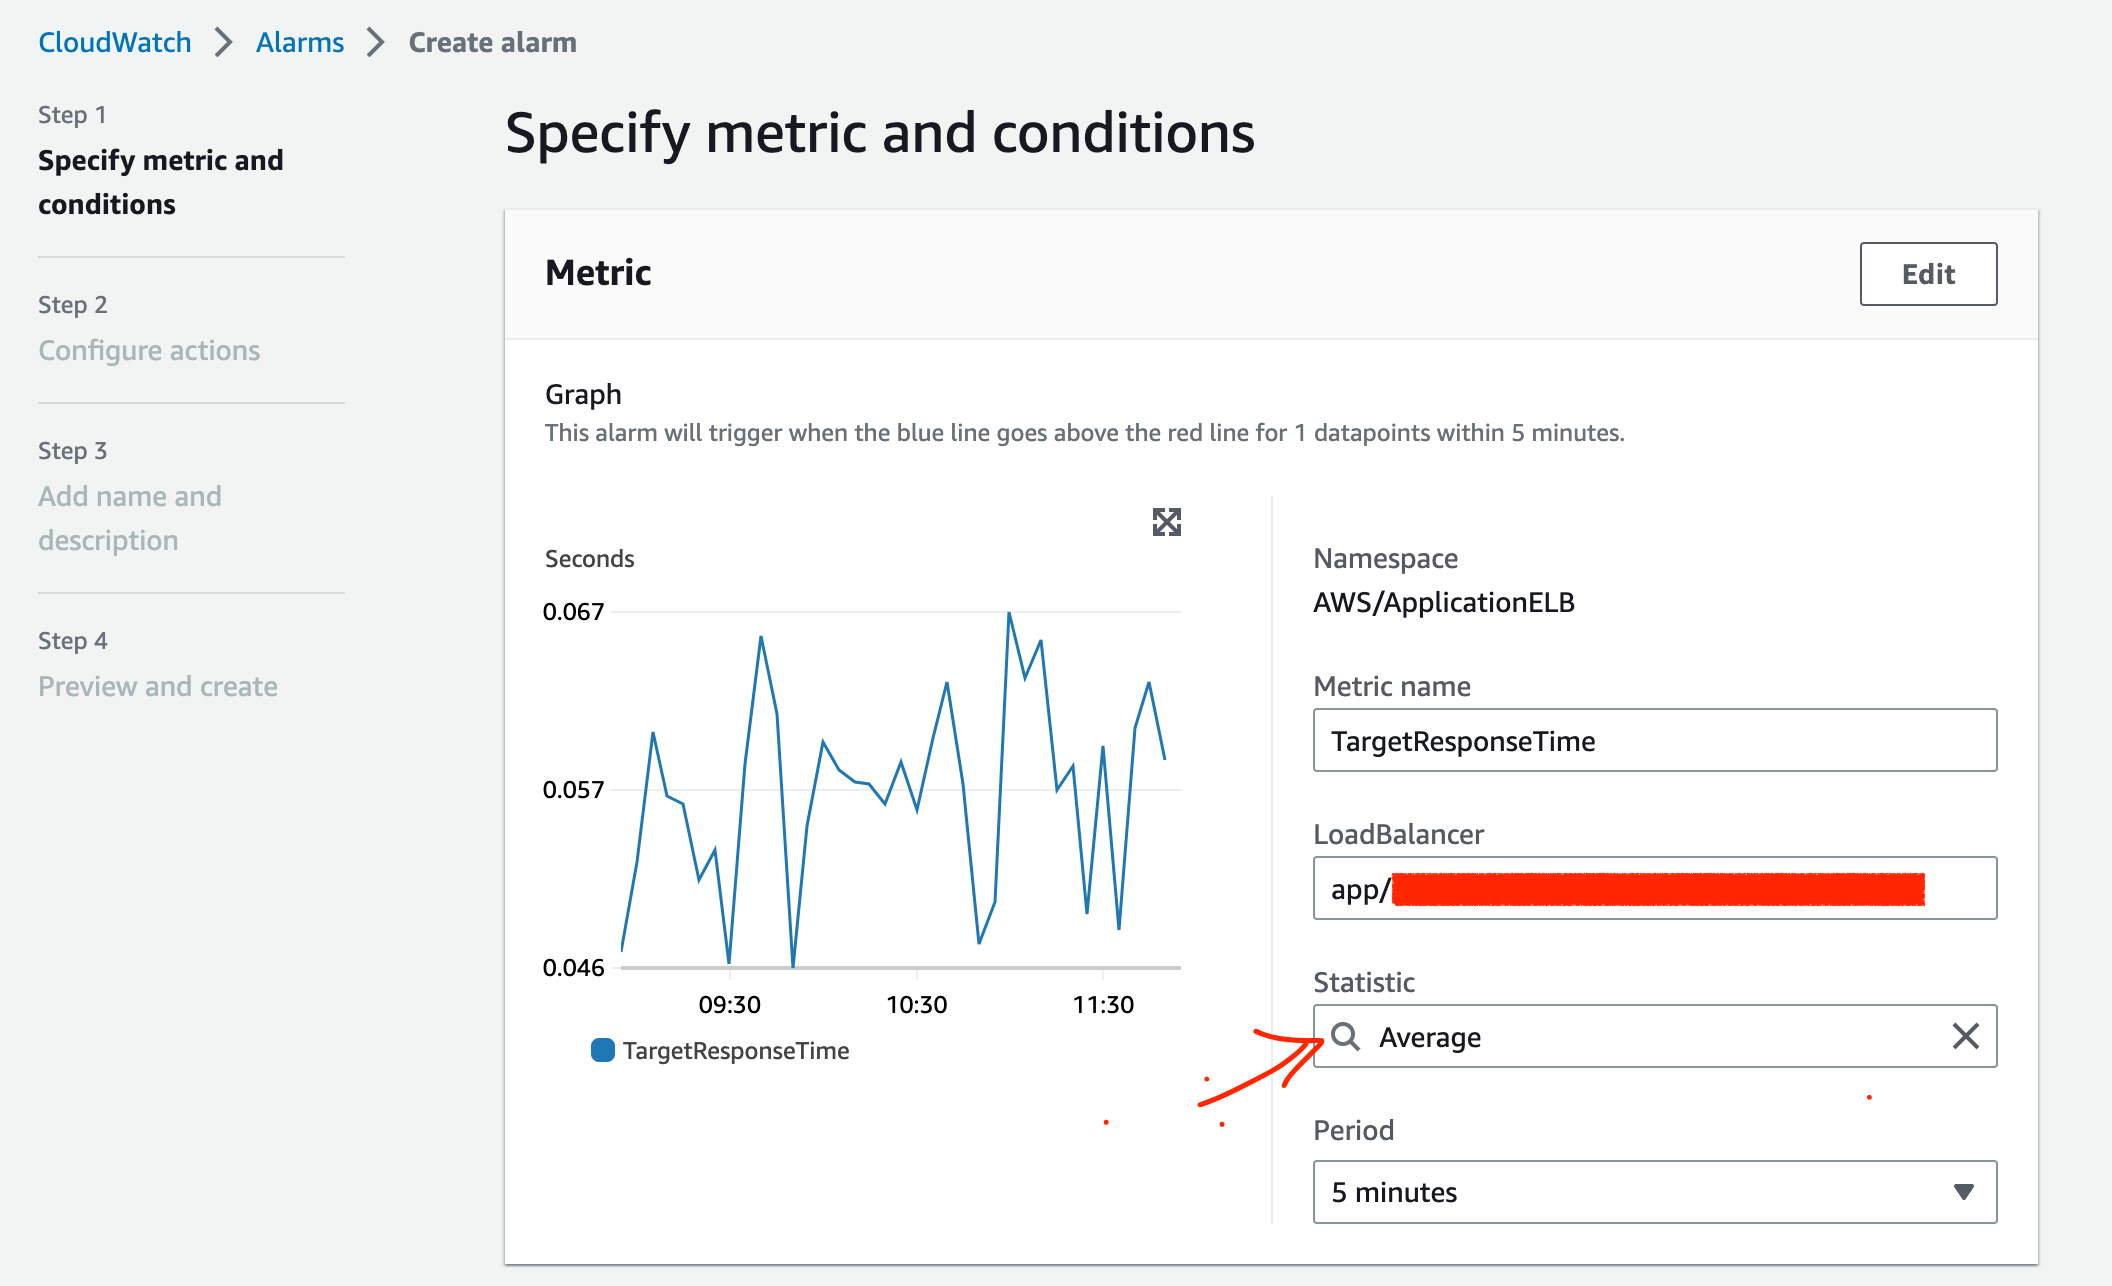
If you look at the arrow, it points to a statistic which says Average it means the chart on the left side the TargetResponsetime calculated with the average for the period selected below
In our case it is 5 minutes which is also the default
In some cases, especially in production, you cannot go for the average target response time of requests in a span of 5 minutes.
you might need this alarm close to real-time as possible, in such cases, you can choose Maximum as your statistic over the default Average
If you choose Maximum you might get false positive alerts too when a single transaction crosses the specified limit or threshold
We can overcome the same by defining the no of events/matches in a specific period.
We can configure it like 5 events in 5 minutes before the monitor is considered alarm
On the same screen if you scroll down a little further you can define the conditions
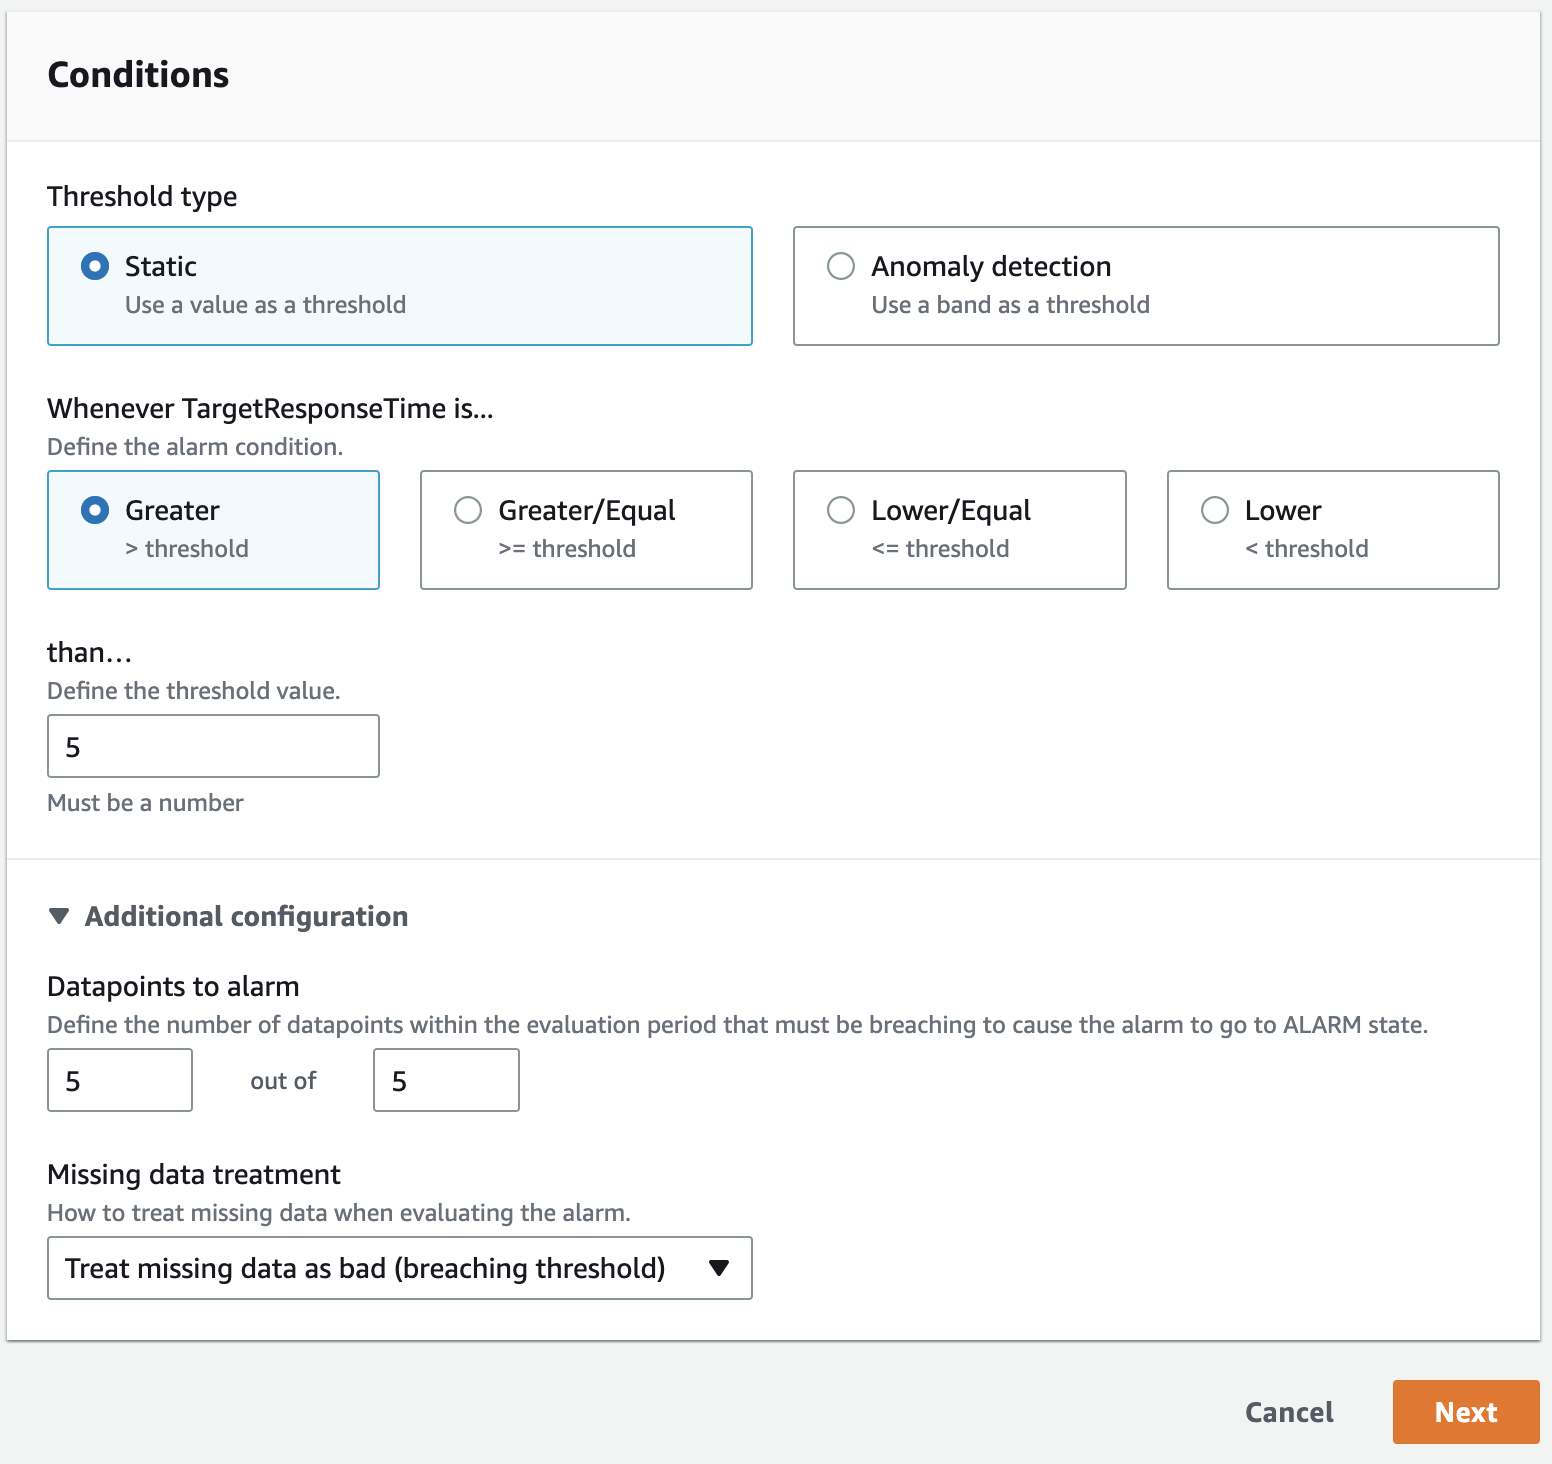
In the preceding diagram, you can see we are defining the following conditions for our alarm
- Count Greater than 5
- 5 out of 5 data points before the monitor considered alarming
- to Treat missing data as bad and an actual alarm
You can choose anomaly detection as well but this is rather straightforward and simple.
Now click on Next
Configure Actions and SNS topic
Now in the Configure Actions screen, you have to choose the SNS Topic which will receive a notification when an alarm trigger
You can choose your existing SNS topic (or) Create a new topic
We are going to create our topic. Just choose Create new topic and enter some name for your SNS topic
In my case it is CloudWatch-SNS-Topic
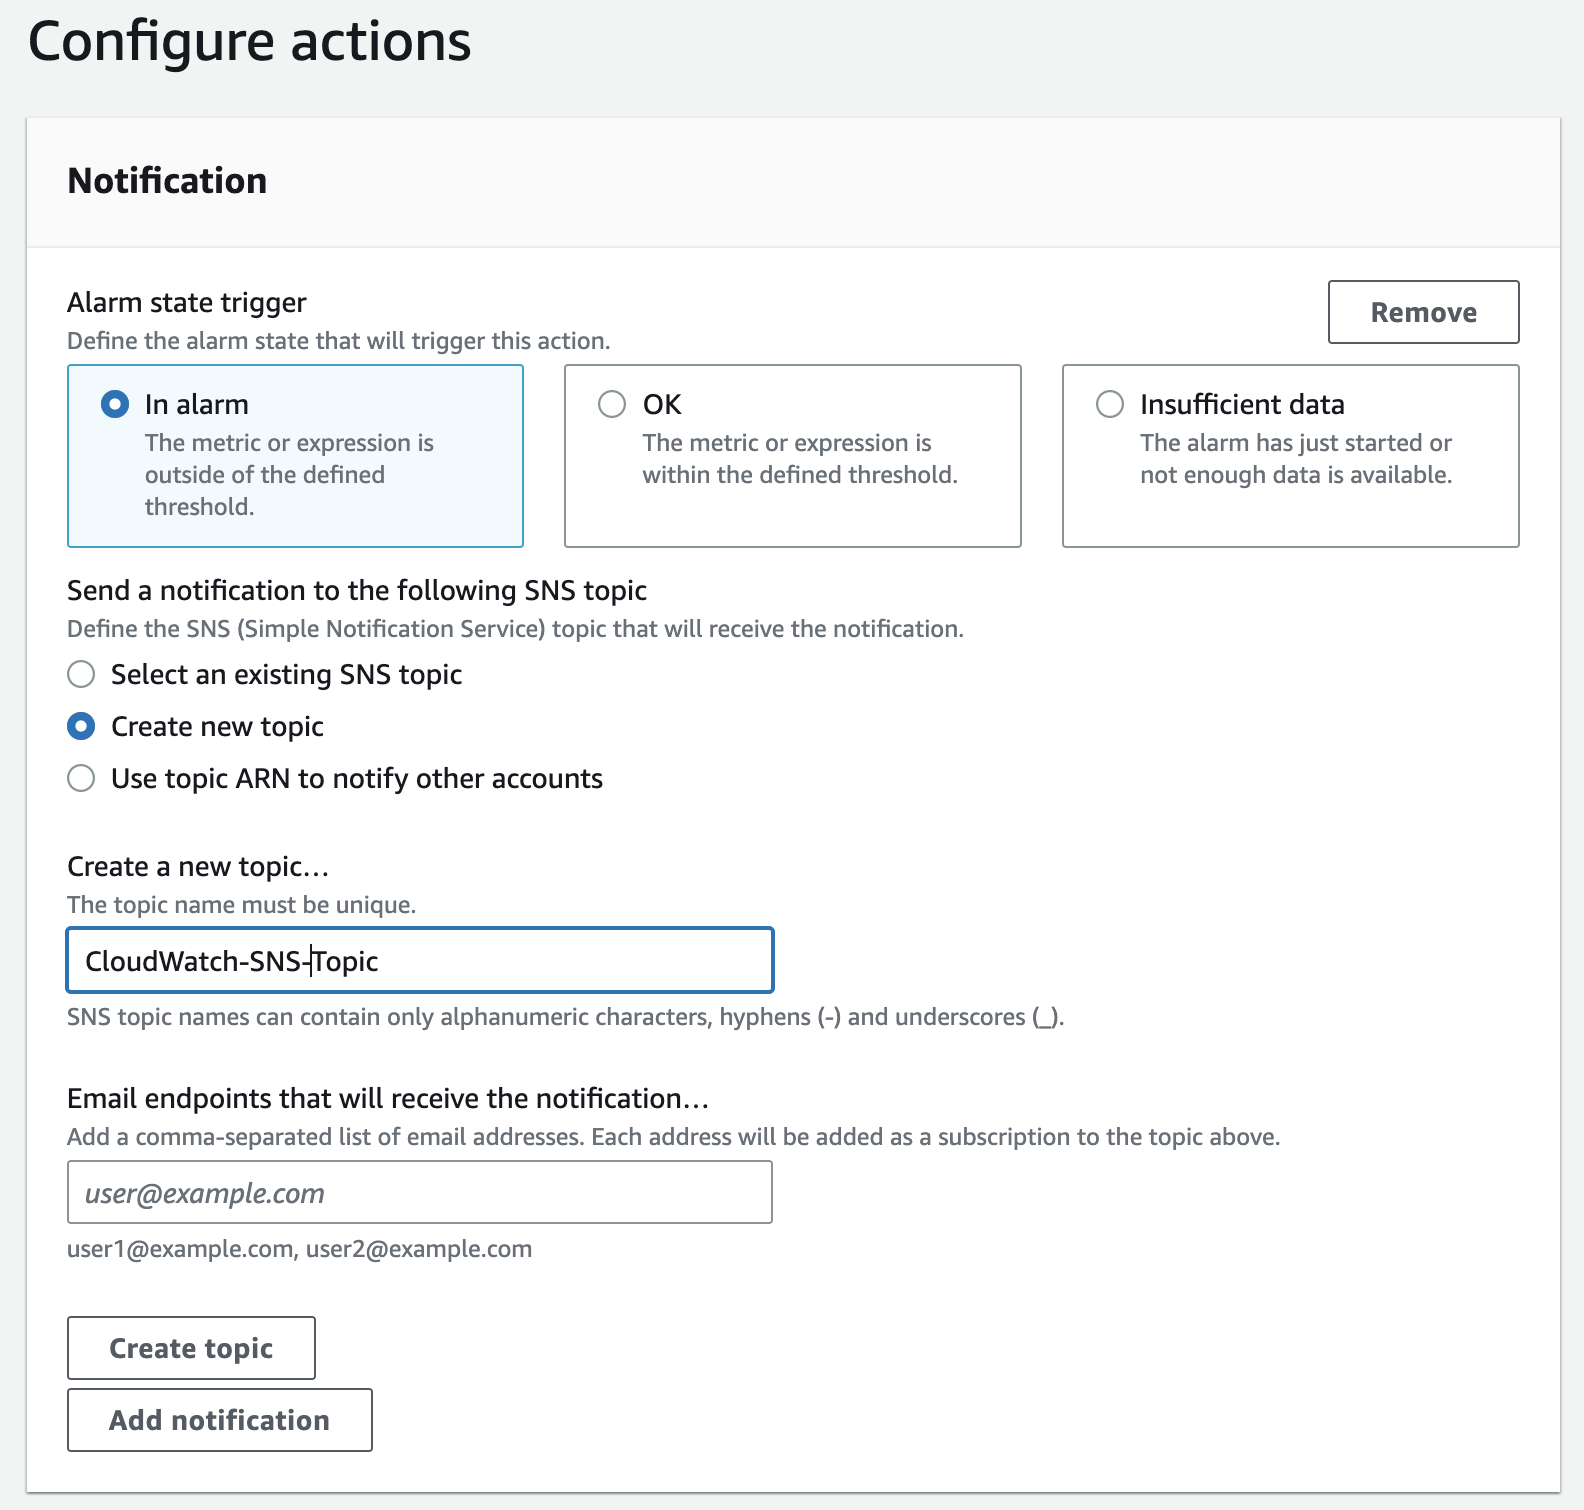
If you are creating it as a new topic, you might have to give some email addresses to receive notifications
Later you can remove it as we would be using slack as our communication platform, not email
If you are creating an email alert, You can optionally use the Email address of your Slack Channel.
Yes, Slack has an integration now where you can create email IDs for your channels
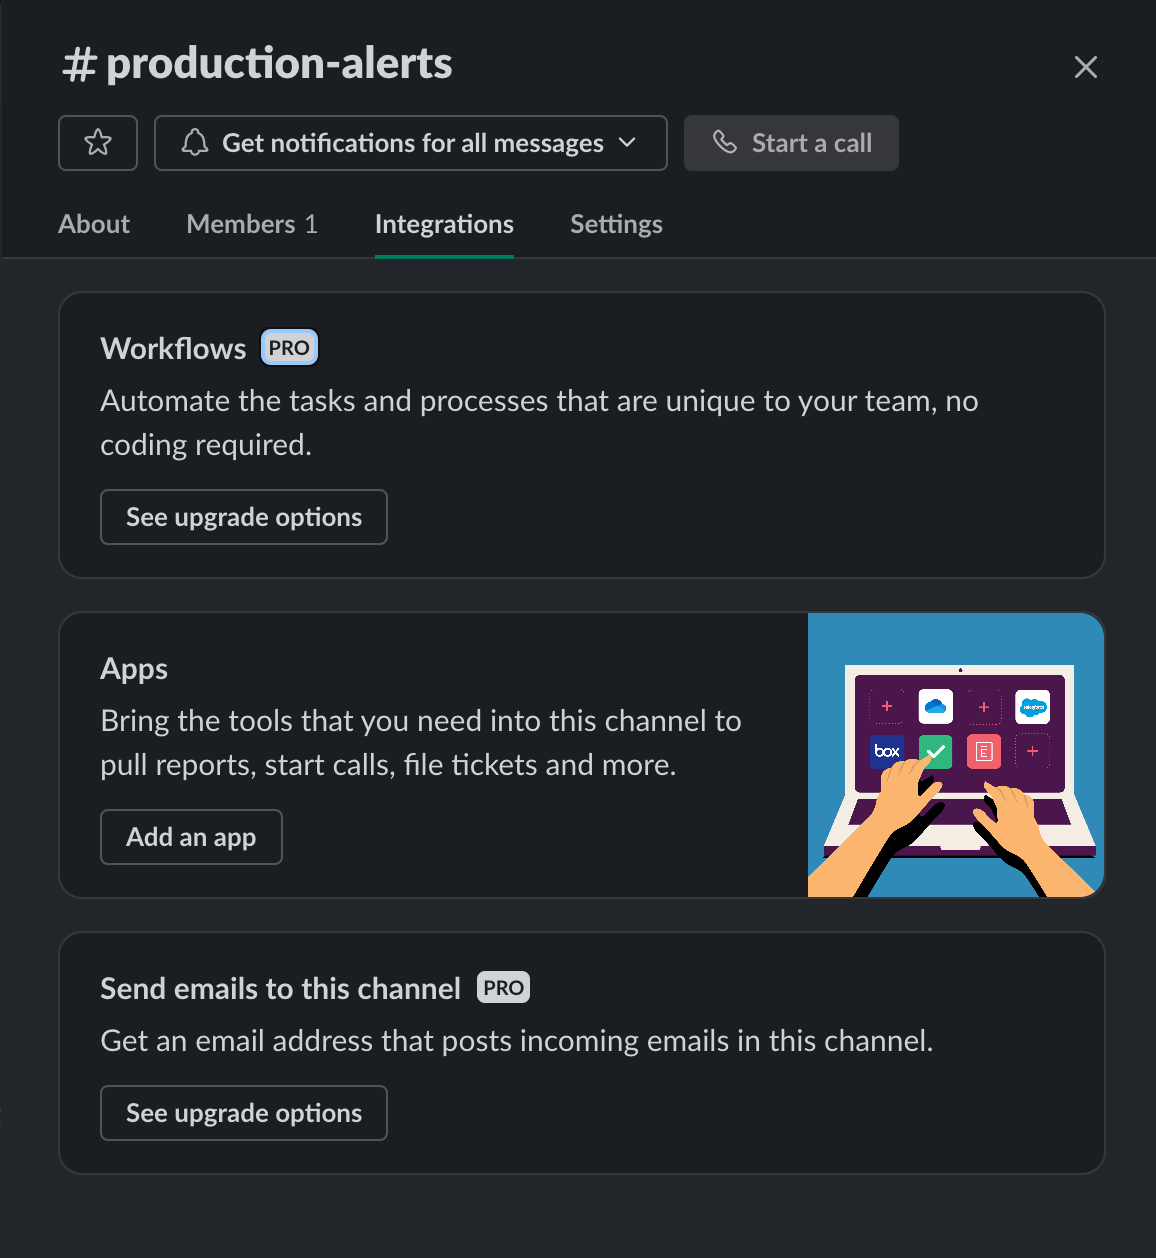
Go to your channel and click on Integrations the last option is to create an email ID for your channel which you can directly use to send emails from SNS
If you already have an SNS topic you can browse and select it here
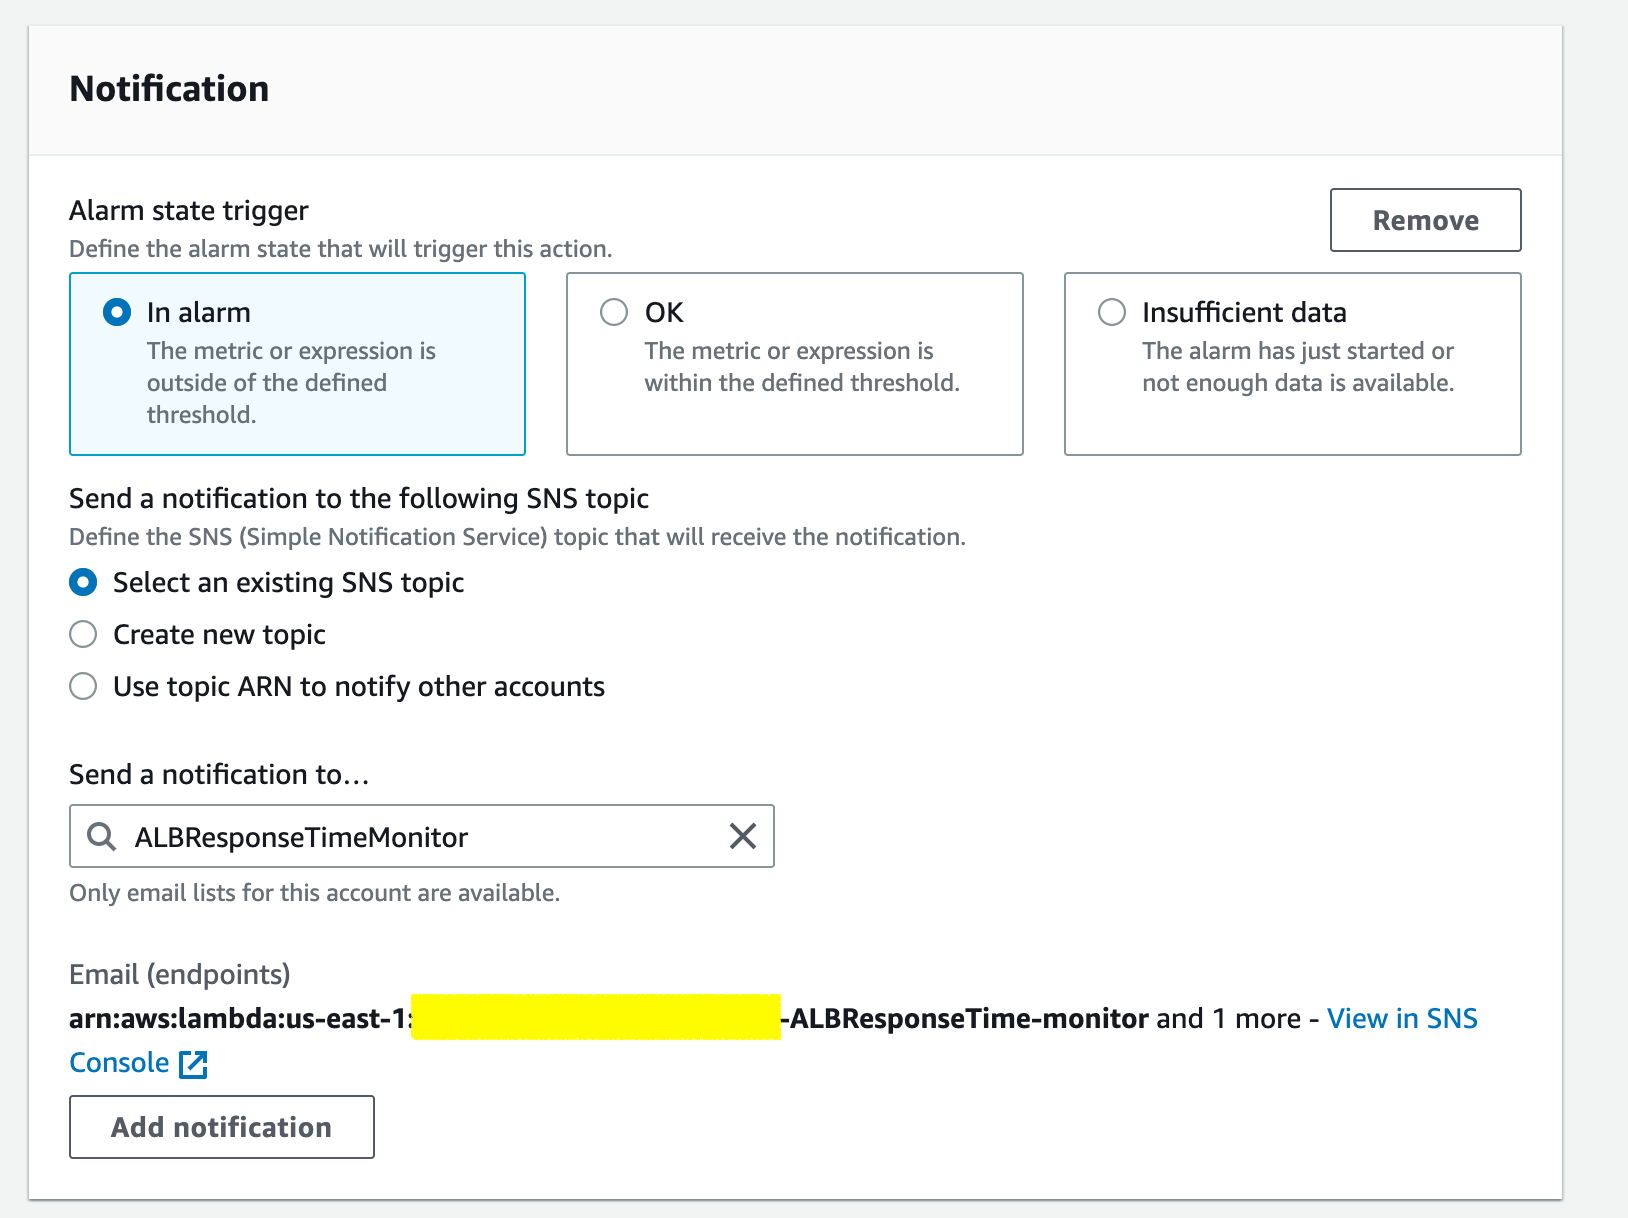
Once you have entered the SNS topic details, you can click Next
You be prompted to enter a Alarm Name and a Description You can give some name to identify this alarm easily
Now on to the Preview and Create Step 4
You can review all your configurations and click on Create Alarm if you find everything to be matching your expectation
Now the Cloud Watch Alarm is ready, On wards to the Slack Integration with AWS Chatbot
Creating AWS Chatbot and integration SNS topic and Slack Channel
As we have completed the first two requirements of our monitoring setup, the only remaining part is Slack integration with SNS topic using AWS Chatbot
In the AWS console, head to AWS Chatbot and click on Configure New Client
Once you click you would see two options, Choose slack and Configure
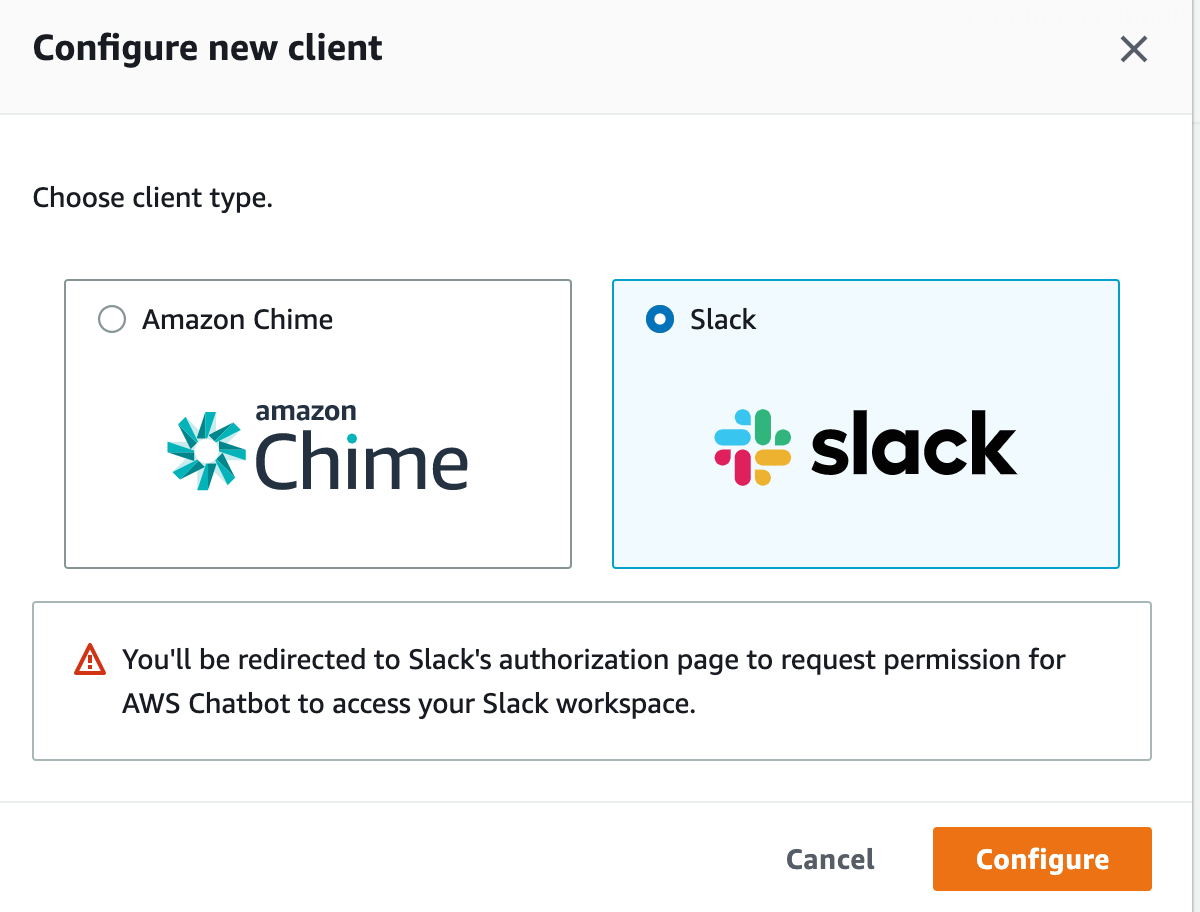
As you click the configure button, you would be redirected to a slack authorization screen
If you are not already logged into Slack in the same browser you would be asked to login
Otherwise, it would choose the Slack profile by default and show the following screen
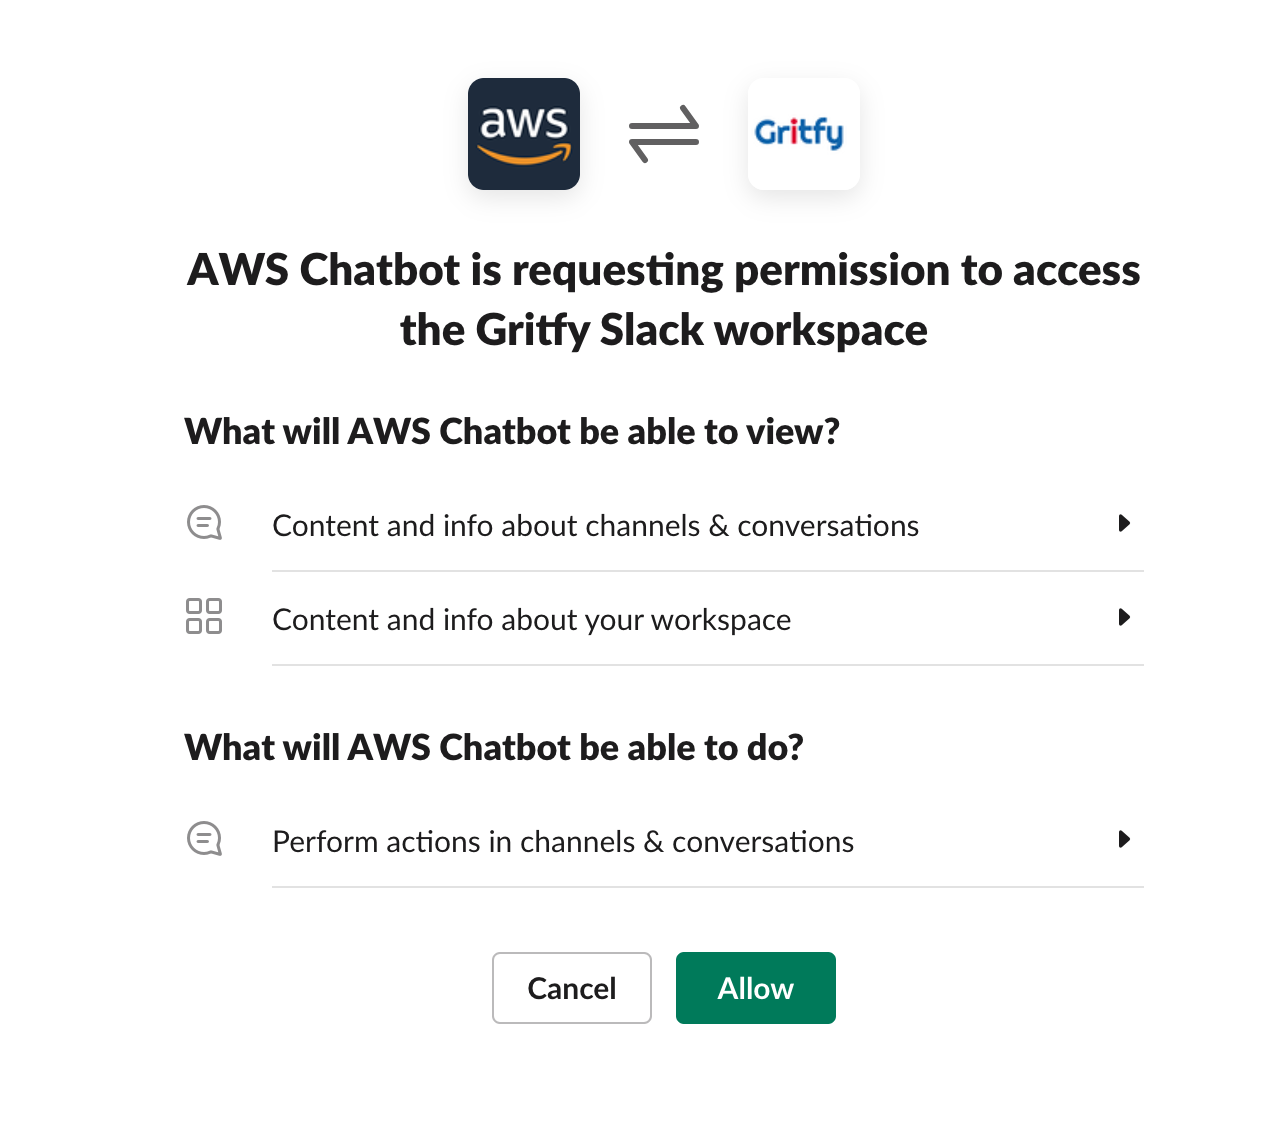
Now click on Allow.
Once you have authorized, you would be redirected to AWS and you can see a new Configured Clients with your Slack Organization name
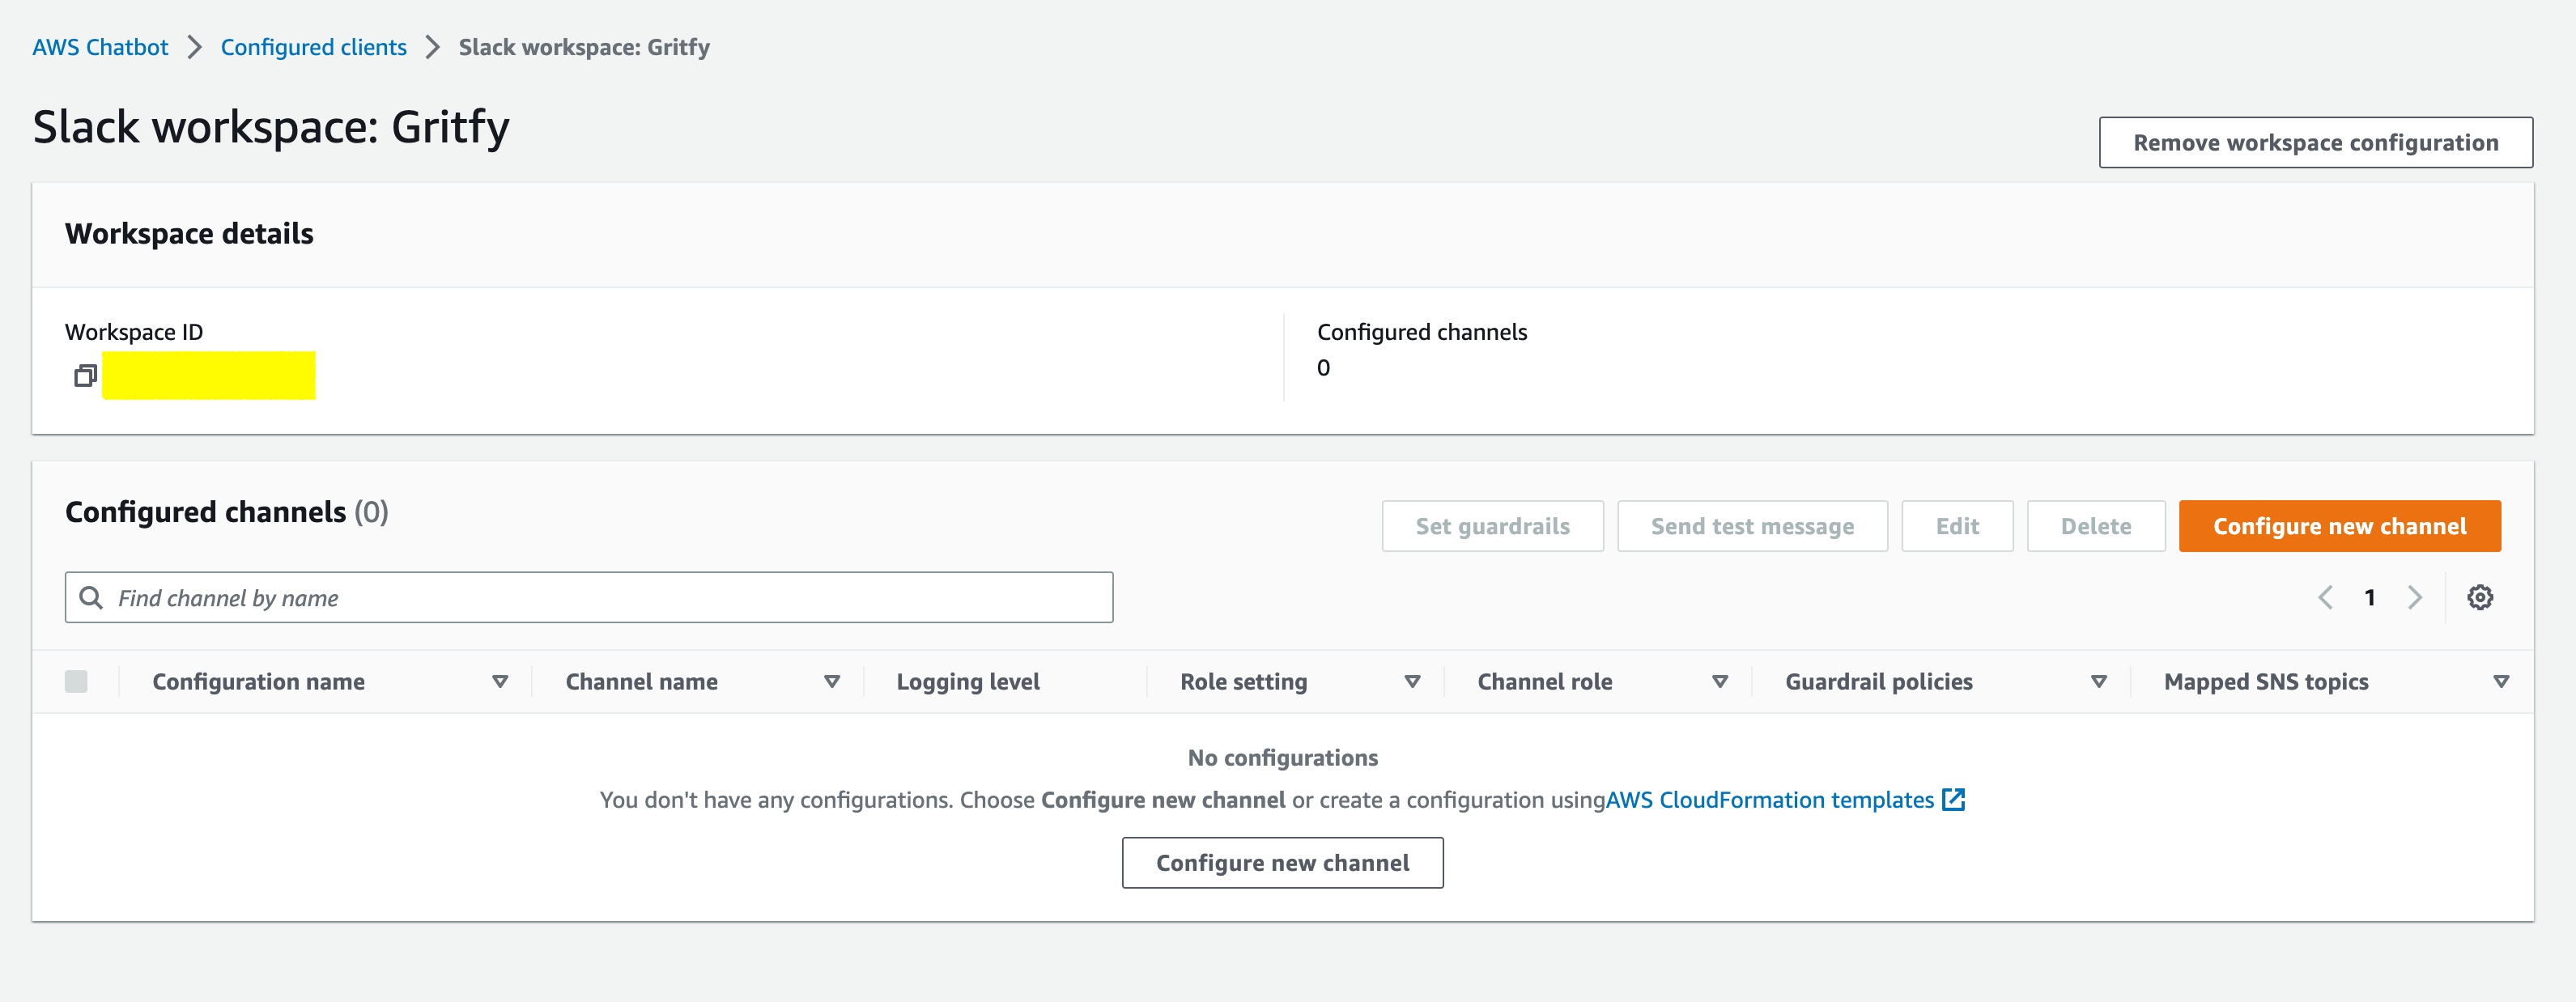
Now on this screen, click on the Configure new channel
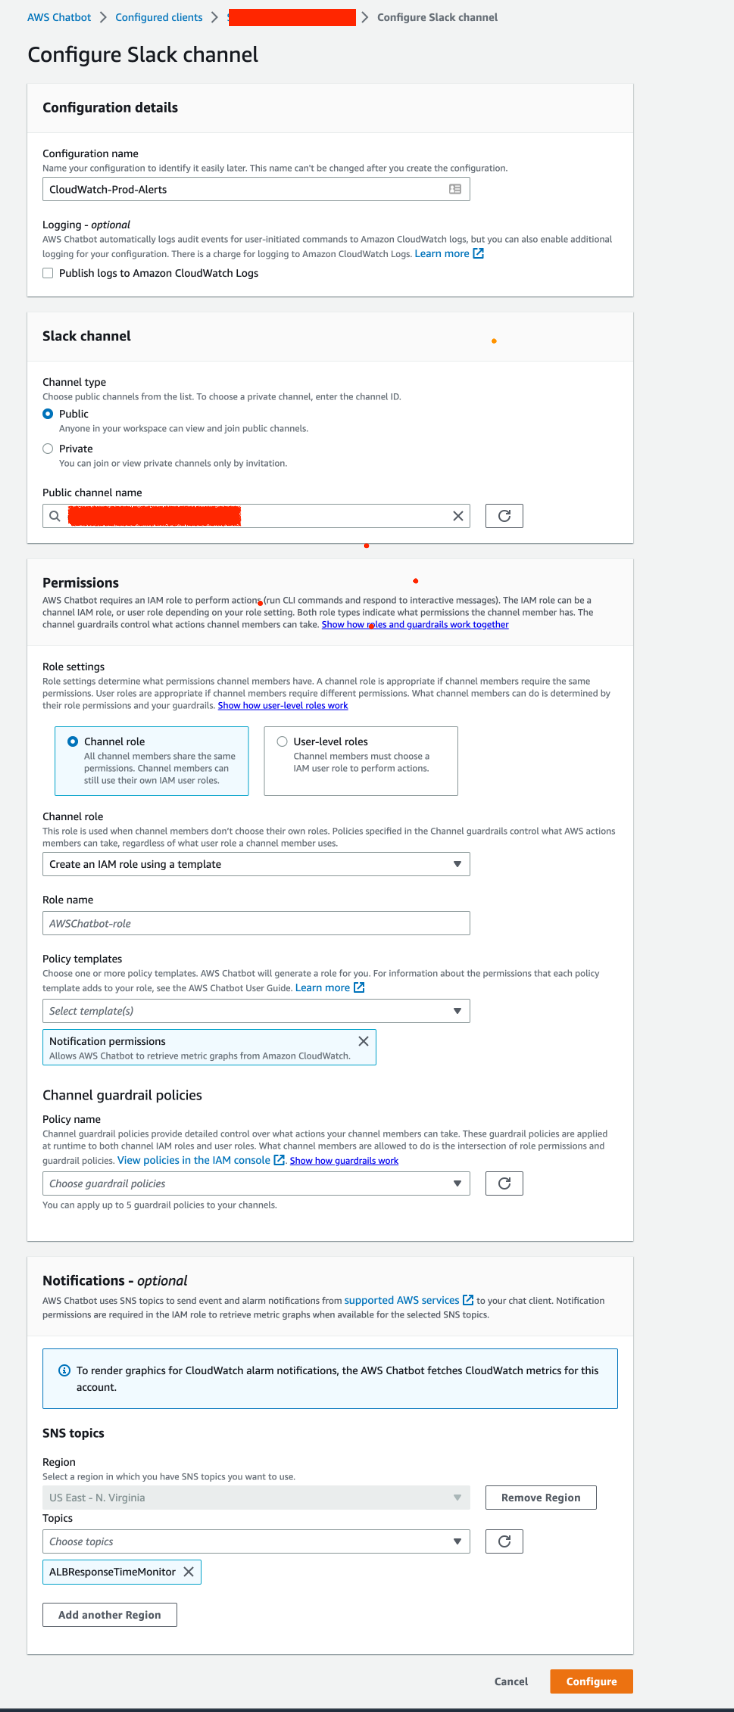
You Need to fill in the following items
- Configuration name - Some Name for your Slack channel configuration
- Channel Type - Public/ Private
- Name of the Channel where the alert should be sent ( browse and select)
- Channel role - You can let it be the default and aws would create an IAM role
- Guardrail policy - To prevent slack from connecting back to AWS and even if it does what permission it can have to the max. You can choose some minimal IAM policy ( read-only)
- Notifications -> SNS Topic - You can choose the SNS topic where the chatbot would look for messages. Subscription model. You can choose the SNS topic we created in the previous section
Once filled with all these items click on the configure to move on.
Refer to the following image as a sample ( some values are not filled in the screenshot)
Now when you click on the configure after entering the necessary details, you would see the following screen
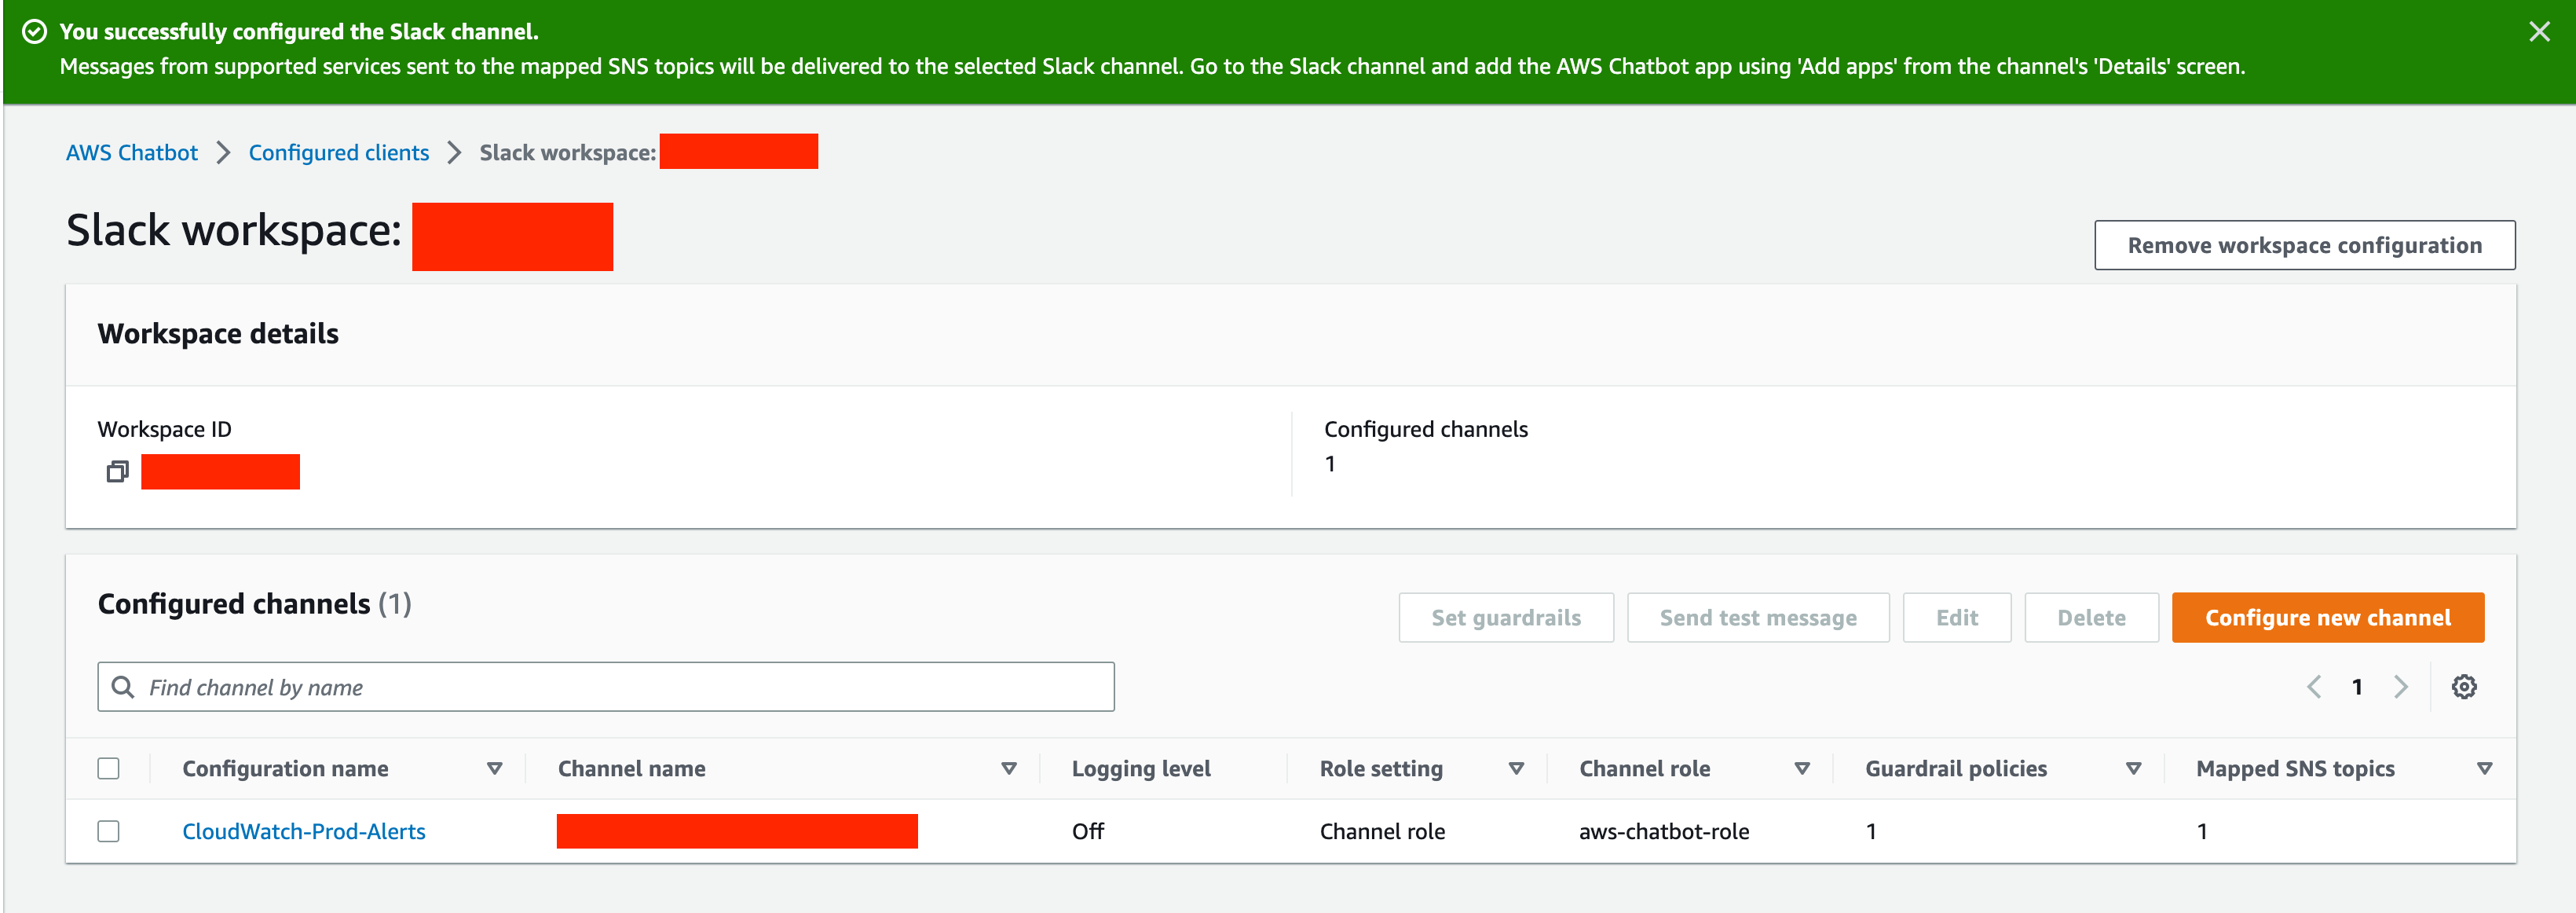
You can see a success message bar on the top with a message You Successfully configured the Slack Channel
It would also instruct what next to be done.
Adding the AWS ChatBot App to the Slack Channel
Go to the Slack channel and add the AWS Chatbot app using Add apps from Channel's Details screen
In the Search bar type aws and choose the AWS Chatbot App and click on Add
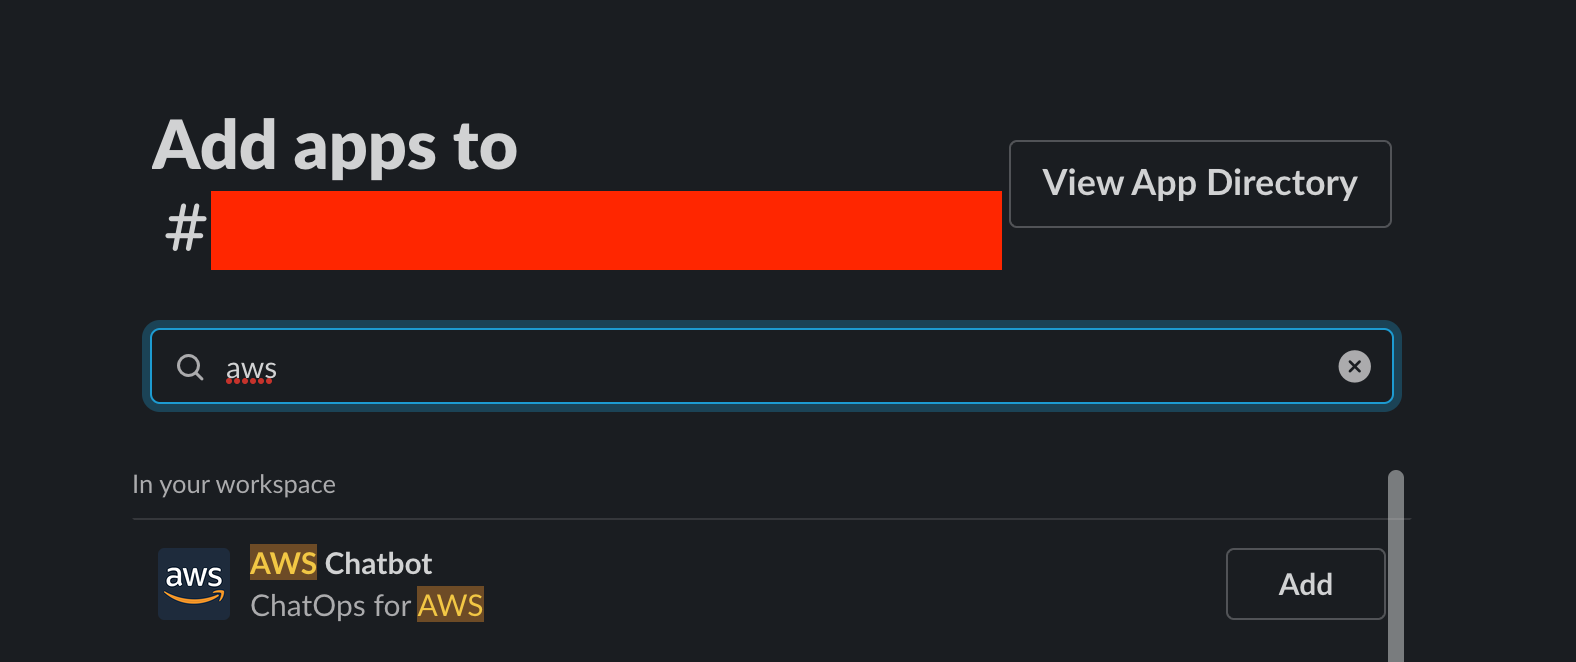
You would see a message aws app was added to the Channel on the channel itself
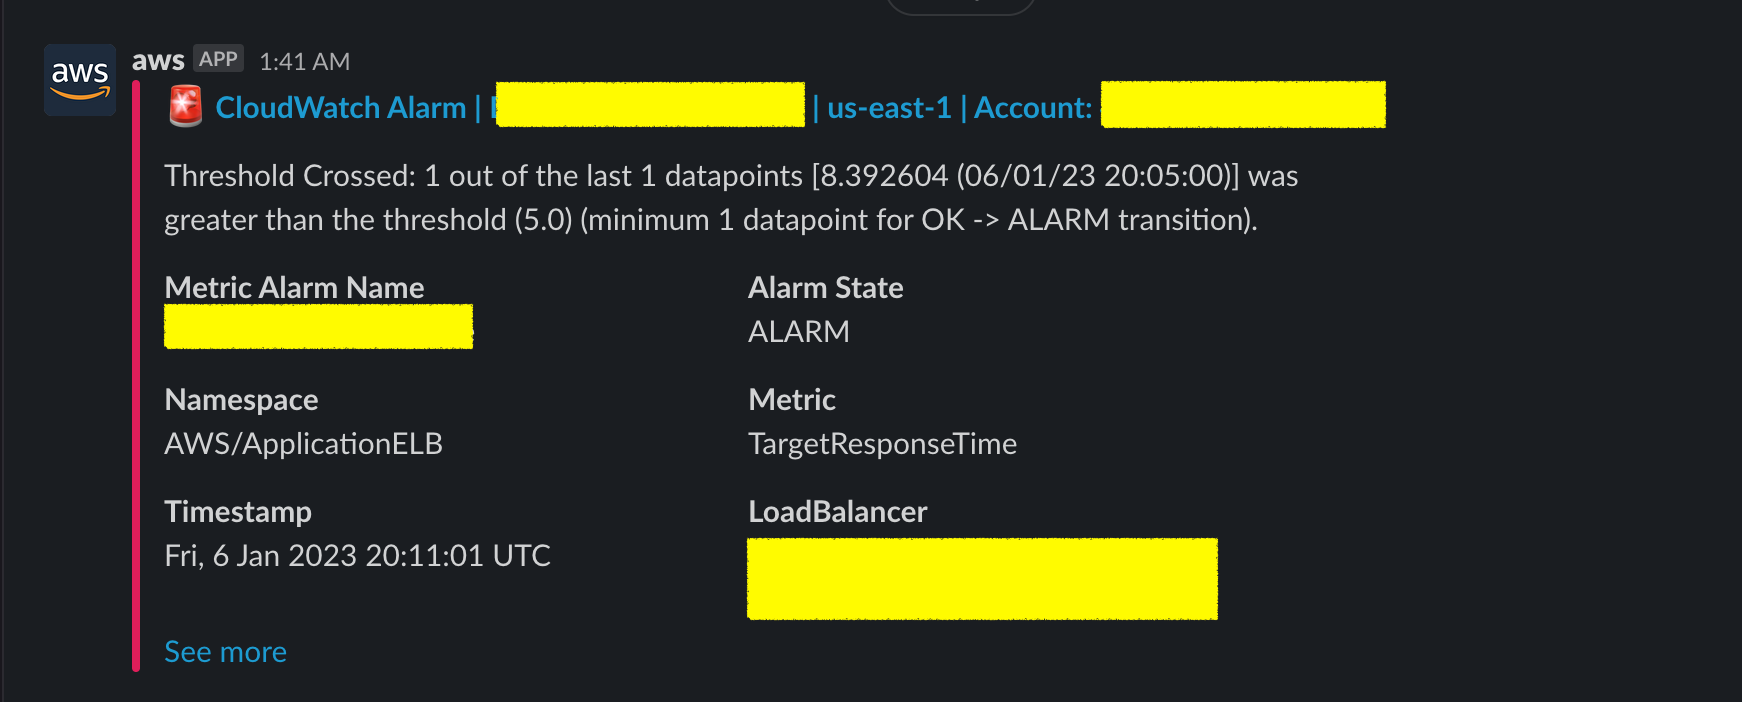
Now whenever the CloudWatch alarm is transitioning to ALARM state you would be notified here on the Slack channel
Conclusion
In this article, you have learnt how to configure AWS Chatbot to send Cloudwatch Alarms to Slack Channel step by step
If you have any questions please reach out to us in the comments section or through our email.
Happy New year 2023
Cheers
Sarav AK

Follow me on Linkedin My Profile Follow DevopsJunction onFacebook orTwitter For more practical videos and tutorials. Subscribe to our channel
Signup for Exclusive "Subscriber-only" Content