Evolution of JMX monitoring
Monitoring is an essential part of Site Reliability Engineering and Infrastructure Services.
I have started my career a decade ago when there was no many JMX monitoring tools and APMs(Application Performance Monitoring) available.
I have worked on my fair share of J2EE Application servers and Servlet Containers starting from Jetty, Tomcat along with enterprise leaders weblogic, Websphere etc.
There was only Wily Introscope available in the APM sector. A former engineer of that project ( Sanjay Bansal) have later ventured to create App Dynamics and it was a big hit.
and there are a lot of products right now for JMX monitoring like Dynatrace, DataDog, Splunk APM but these are all in the Enterprise sector.
But what products are for Small and medium companies and what OpenSource product options available for JMX monitoring and APM solutions?
Well, I am going to write few articles on the journey I had on these open-source JMX and APM products which served really well for me and hope it would help you too.
Stay Connected and Subscribed for further articles.
My Favourite JMX Monitoring tools of a Decade. - THEN
Irrespective of the Application server I chose, when something goes wrong. I used to go on a pursuit of these JMX monitoring tools to check the internals.
So you can presume here that I was not always blessed with these Super APM tools and these manual or semi-automated tools taught me a lot of troubleshooting
Here are some of my favourites
- jmxterm - CLI based JMX monitoring tool
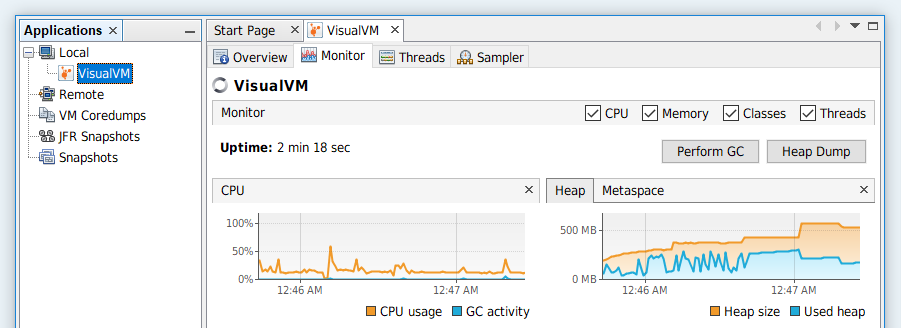
- visualvm - From Oracle
- Jconsole - From Oracle bundled with JDKs
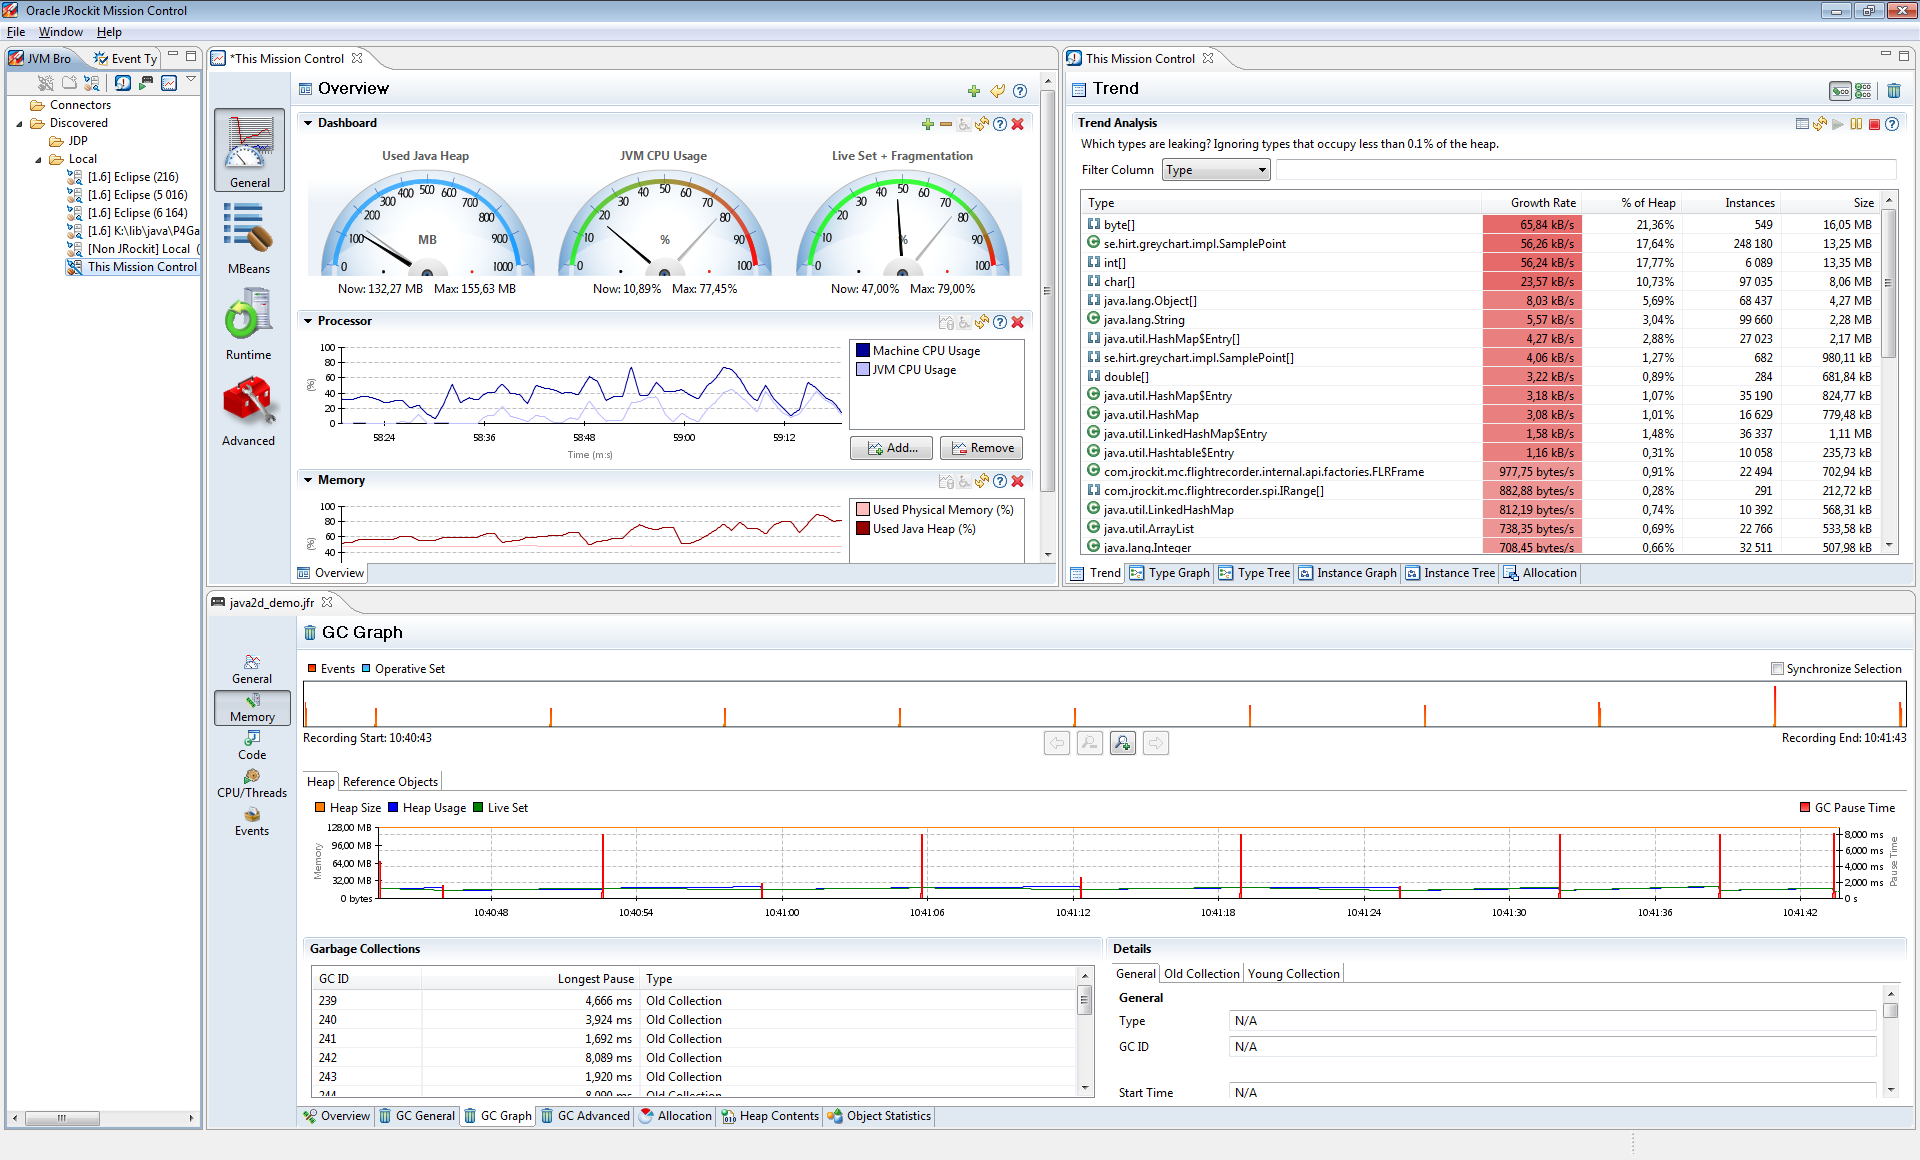
- JRockit Mission Control - Renamed to JDK Mission Control
While these are my top favourites on the list, there are more I might have used once or twice.
This is a quick video of Java Mission Control and its capabilities.

What's new? - NOW
I have recently had a chance to explore two wonderful JMX monitoring tools that I want to write about.
These JMX monitoring tools are well advanced and can easily be integrated into your infrastructure and help you automating various monitoring requirements of your JVM or application server.
- Connection Pool monitoring
- HeapSize monitoring
- Session monitoring
- Thread monitoring
- Application Profiling
- Custom matrics
the installation or integration of these tools are as simple as dropping the war files into your autodeploy directory and start using it.
It does not leave a large footprint as well on the JVM so no worries.
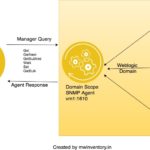
Jolokia - This one is cool, not spicy

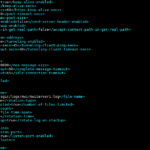
Jolokia is a simple WAR or JAR file type of implementation. you can install it as an agent by adding the agent JAR into the classpath.
Or dropping the WAR file and auto-deploy. the latter one is my choice.
I prefer to have API endpoints to monitor the status of my application and that's what Jolokia does
This is how they are defining themselves.
Jolokia is a JMX-HTTP bridge giving an alternative to JSR-160 connectors. It is an agent-based approach with support for many platforms. In addition to basic JMX operations, it enhances JMX remoting with unique features like bulk requests and fine-grained security policies.
here is a quick snapshot of the JSON result of Jolokia.

You can process these data to get what you want. It supports Bean invocation over REST API as well. so you can get all the matrics you want and monitor them.
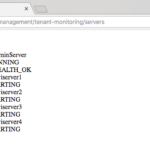
Here is a sample REST API URL to get the Heap Memory Usage
https://sampleapp.gritfy.com/jolokia/read/java.lang:type=Memory/HeapMemoryUsage
The result would be something like this
{"request":{"mbean":"java.lang:type=Memory","attribute":"HeapMemoryUsage","type":"read"},"value":{"init":1585446912,"committed":1546649600,"max":1546649600,"used":680788288},"timestamp":1618011377,"status":200}
Refer to the following screenshot

while this is suitable for most of your monitoring solutions like nagios and advanced. It has no GUI and our next product comes to solve the same.
Hawt.io - A Better GUI for Jolokia
As they claim. Hawt.io is a modular web console for managing your java application and they are precise about it.
A Single image could explain it better than I can put it in words.
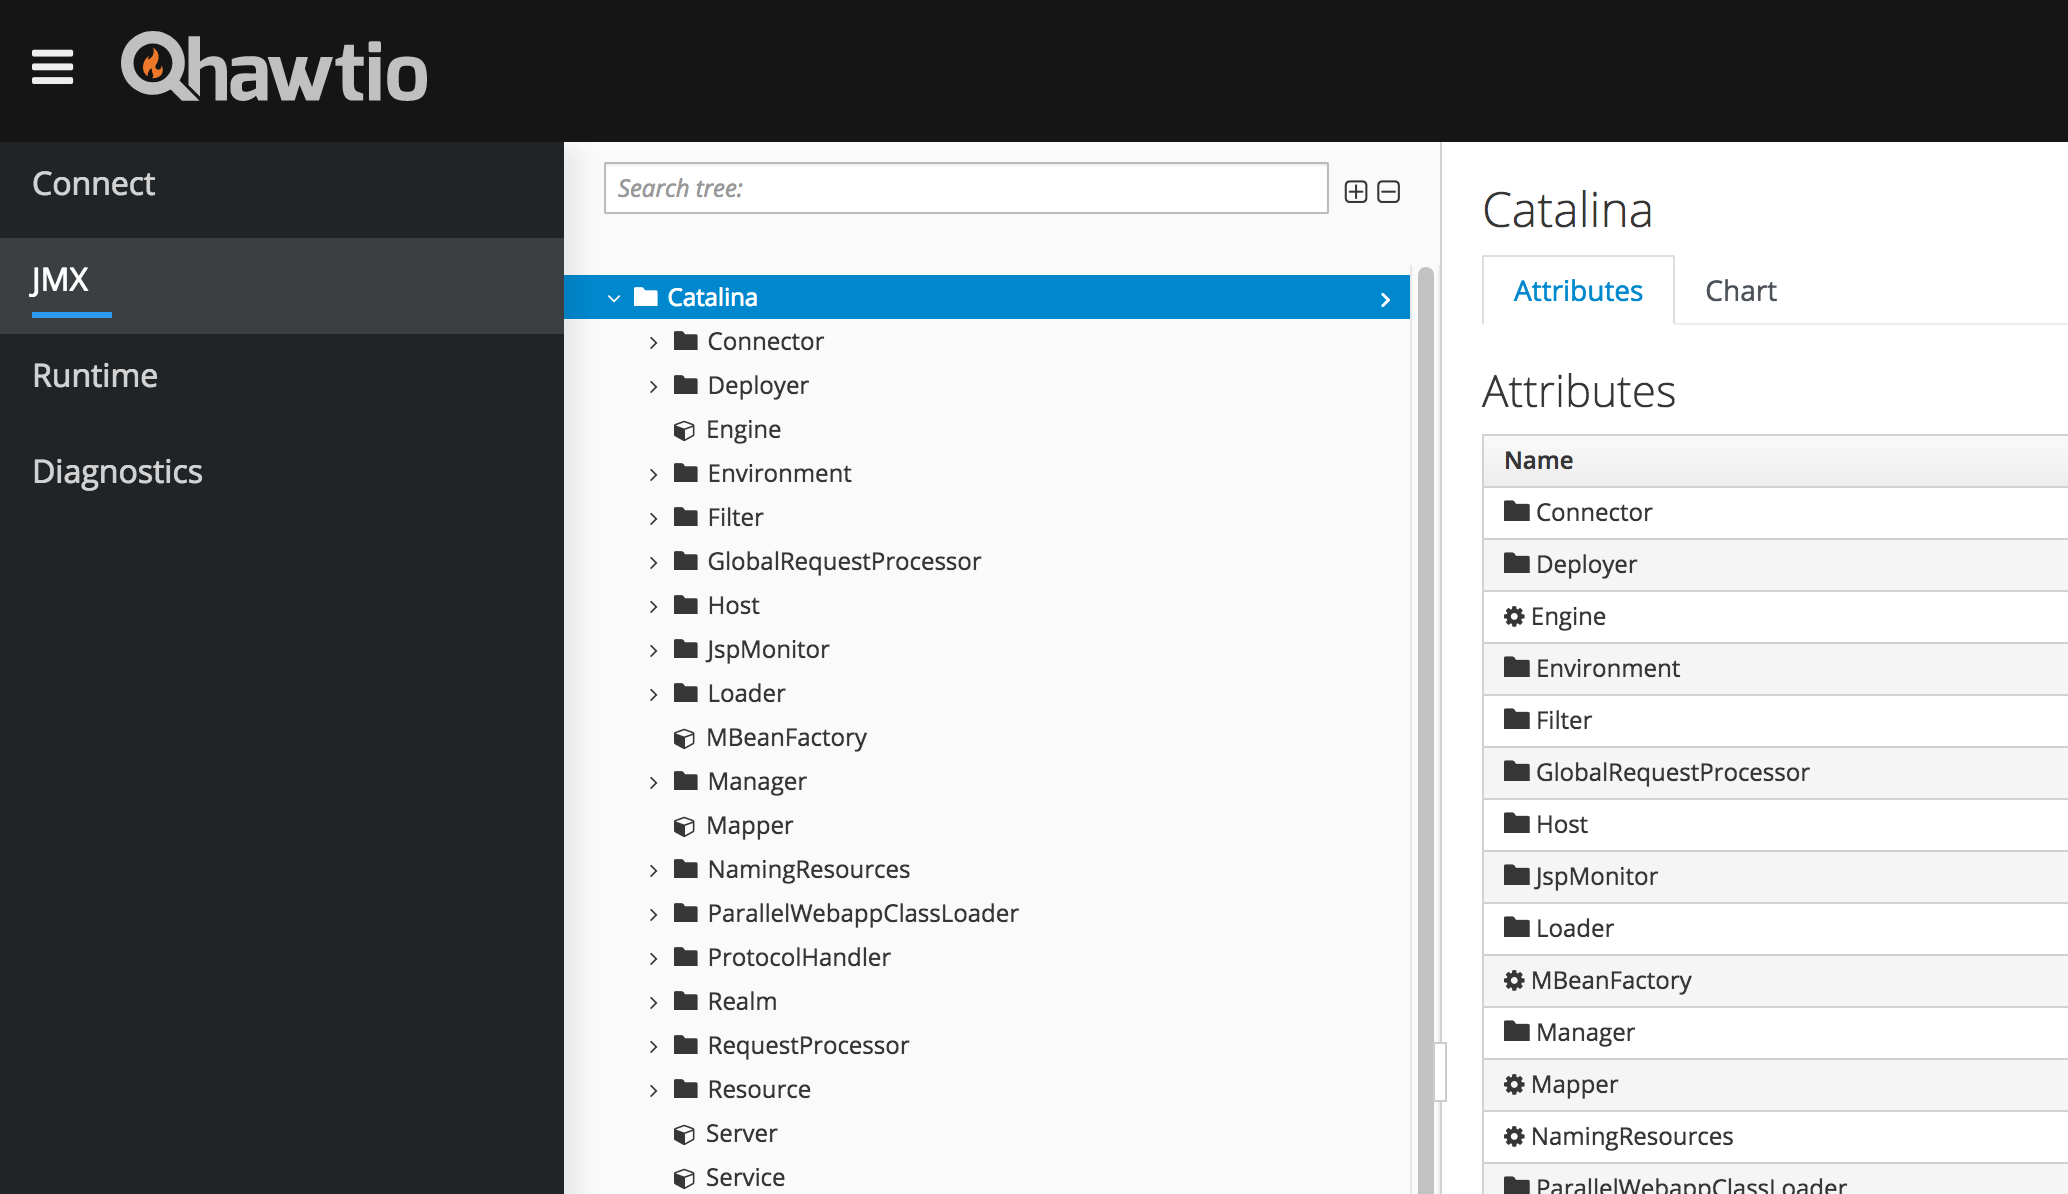
There you go. that's what you get after few minutes of dropping the hawt.io WAR package in your webapps or auto-deploy directory of your application server
It can be Tomcat, weblogic, Websphere, Liberty whatever. It works Splendid
I must highlight that it is built on top of Jolokia and also supports Jolokia API endpoints we discussed earlier section.
In a Single WAR file, you get both GUI and API endpoints.
Conclusion
As I have mentioned earlier of this article. I am planning to write SRE tools series in DevopsJunction and this is a nice start I believe and I hope these tools are helpful to you.
Do you have any JMX monitoring tools that I must know. Please comment.
Sharing is Caring. Don't you know 🙂
Cheers
Sarav

Follow me on Linkedin My Profile Follow DevopsJunction onFacebook orTwitter For more practical videos and tutorials. Subscribe to our channel
Signup for Exclusive "Subscriber-only" Content